GRIDINT · DATA RESEARCH, ANALYSIS & CONSULTING
Data-driven stories from any part of the world's grid.
GRIDINT is grid intelligence. We are a data research and analysis house: point us at any part of the world's grid — an industry, an event, a market, a question — and we return the intelligence on it — analyzed, visualized, and told as a story you can verify, at the speed of our platform, with the rigor of a research lab.
The instrument is a page: Thirty Days of Earth →
Answered from the records this site holds — the same index the search page reads, matched on this device. Nothing you type leaves it.
The five flagships.
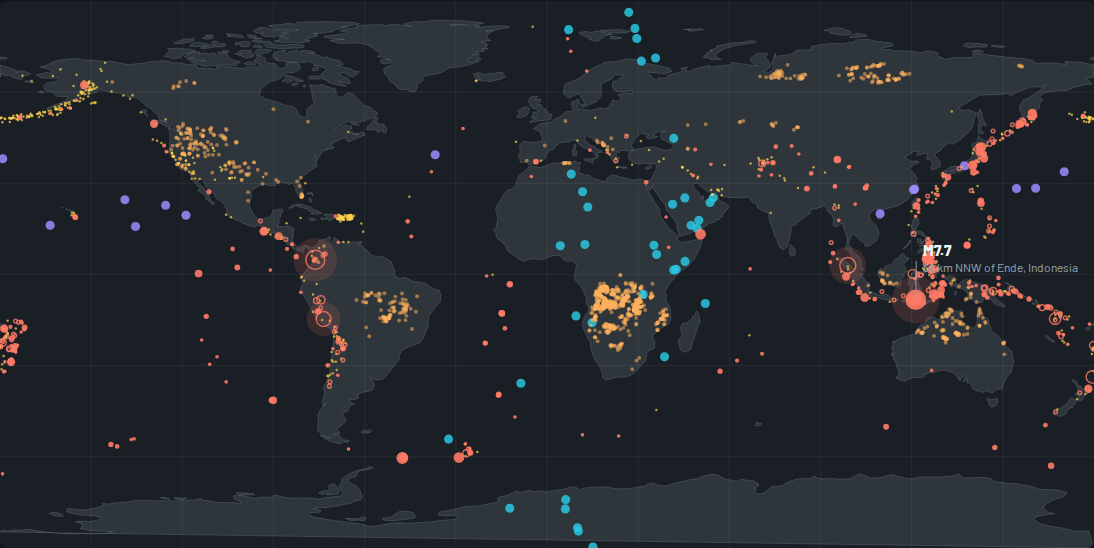 Thirty Days of Earth637 quakes M4.5+ in 30 days — one M7.7published 2026-08-27 · data cutoff 2026-08-27the power
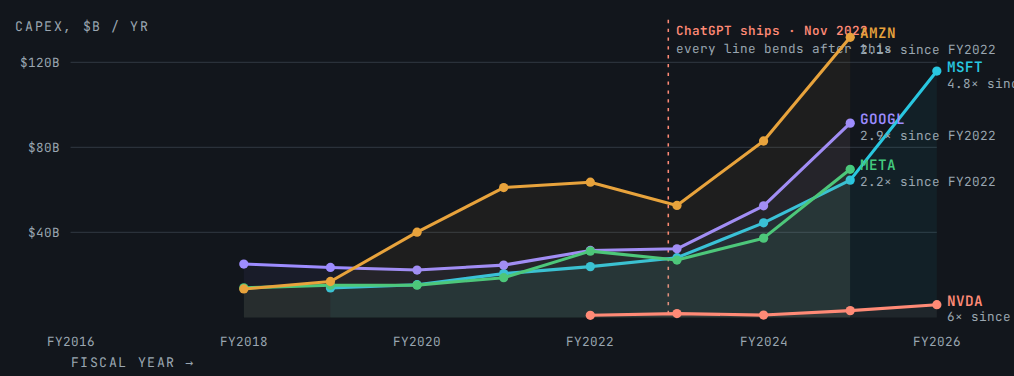
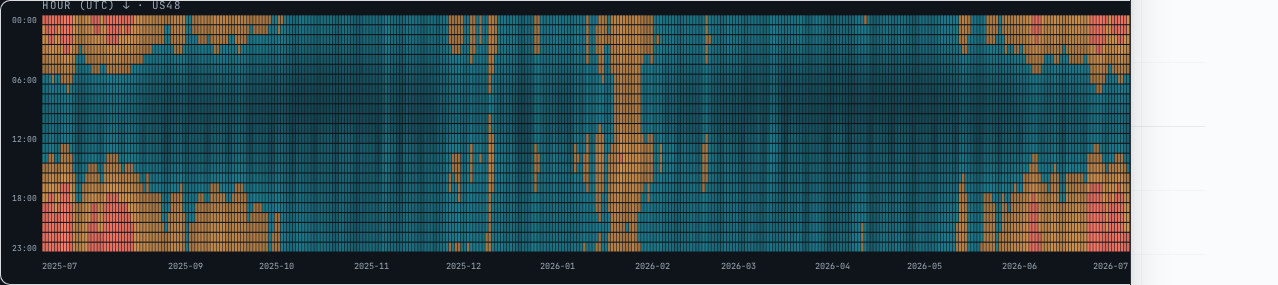 The Grid Under Load13 regions by daily peak · 2 of them and the national aggregate hour by hour — a national peak hour of 761,177 MWhpublished 2026-08-27 · data cutoff 2026-08-26the moneyThe Circular Machine0 of 21 edges trace to a filingpublished 2026-08-27 · data cutoff 2026-08-27the machinesThe Data Center Decade$69B → $361B filed capex, 5.2× (FY2019→FY2025)published 2026-08-27 · data cutoff 2026-08-27the peopleThe AI Layoffs Ledger15 events on the ledger — 6 with a count verbatim in a filingpublished 2026-08-27 · data cutoff 2026-08-26
A think tank that produces.
Written research, not dashboards: BI-grade analysis told as stories, dense with purpose-built visualization, edition-dated so a citation stays true forever. Our exhibit law is absolute — every chart explains what you are looking at, names its method, and carries its source.
We never create data, and we never provide it. What we build is the lens: existing records from reputable, receipt-able sources — filings, safety corpora, geophysical records, clinical registries, economic ledgers — pulled on schedule, provenance stamped at ingest, refused if they arrive without a receipt. The source remains the authority, always; we organize, verify, and point back to it.
Any firm. Any theme. Any data realm. The same pipeline that maps a planet's seismic month or traces a capex wave through SEC filings can be pointed at your industry, your market, your operational data — and return the same standard: receipts-first analysis, publication-grade visualization, and a story your board can actually use.
- USGS1,928earthquake records + M5.5+ catalog rowsFDSN event service
- EIA28,827hourly grid readings14 regions
- SEC EDGAR5,041filed capex rows + filed submissionsXBRL companyconcept
- NASA7,728events and worldsEONET · Exoplanet Archive
- NTSB30,968investigationsaccident database
- ClinicalTrials.gov987registered trialsAPI v2
- NASA GISS1,759monthly temperature recordsGISTEMP v4
- World Bank14,073fertility observationsSP.DYN.TFRT.IN
- U.S. Treasury8,616debt observationsFiscal Data
- OWID / Ember130generation-mix observationsEmber + Energy Institute
- CelesTrak16,472active satellites, every orbitGP catalog + named groups
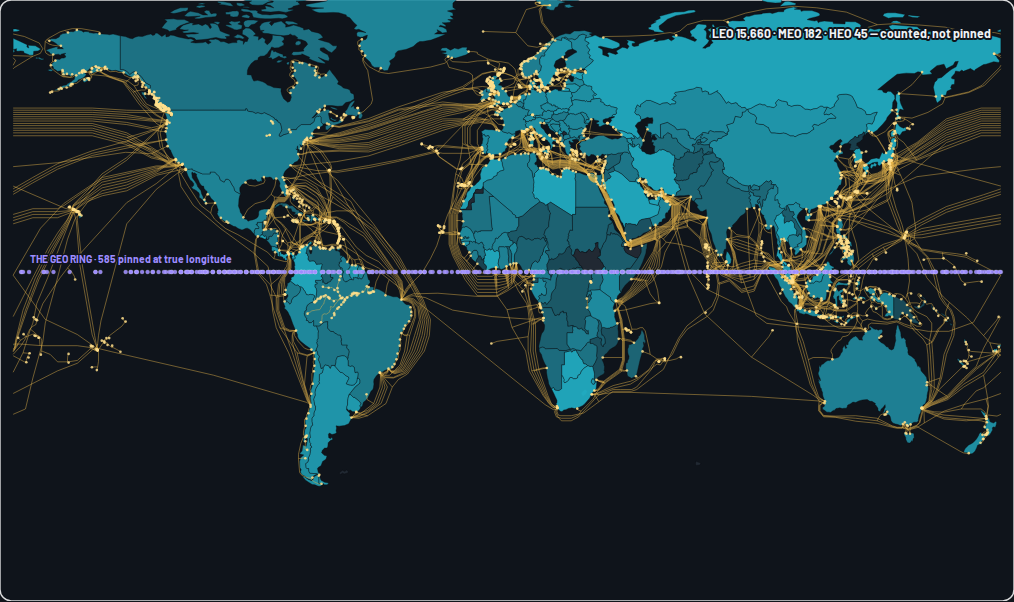
- TeleGeography2,644cable paths and landingssubmarine cable map
- PeeringDB40,466facilities and networksfacility + network registry
- LBNL33,256interconnection requests (the source states the count)Queued Up 2025
- The layoffs ledger15tracked events, each class-markedCURATED BY US — not an official feed
- The circular machine21stated relationships, 12 with no figureCURATED BY US — not an official feed
- Data hubs7explore, filter, verify
- Reports29edition-dated, receipts on every figure
- Every figure traces to an official record.
- Editions, never silent edits.
- Analysis is labeled as analysis.
- Nothing tracks the reader — no tiles, no third-party anything.
One planet, every report it appears in.
Tap a country — every line is a record this site holds about it.
THE REST OF THE SHELF
24 more edition-dated reports · the full library →
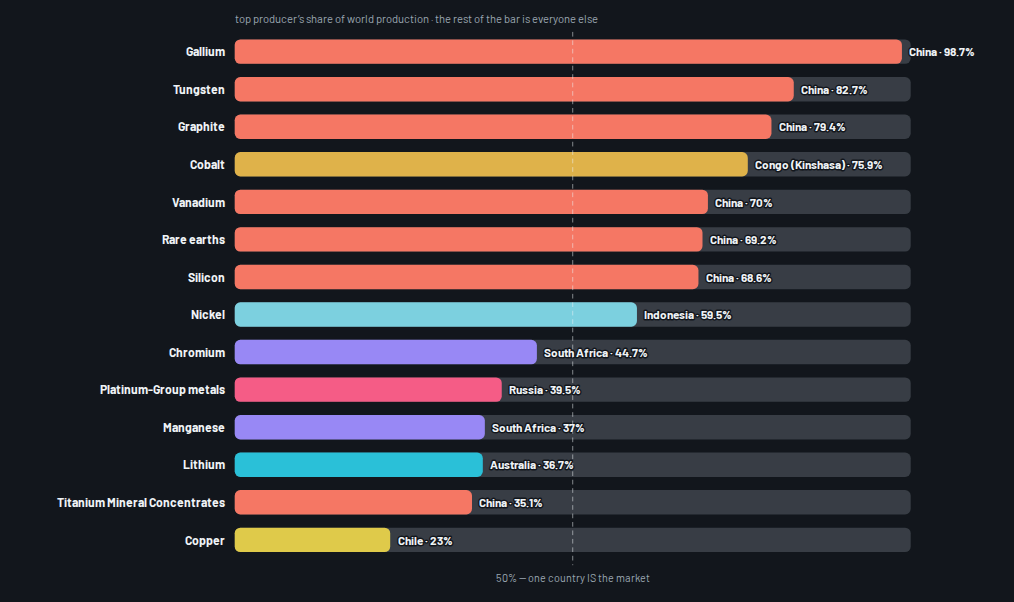
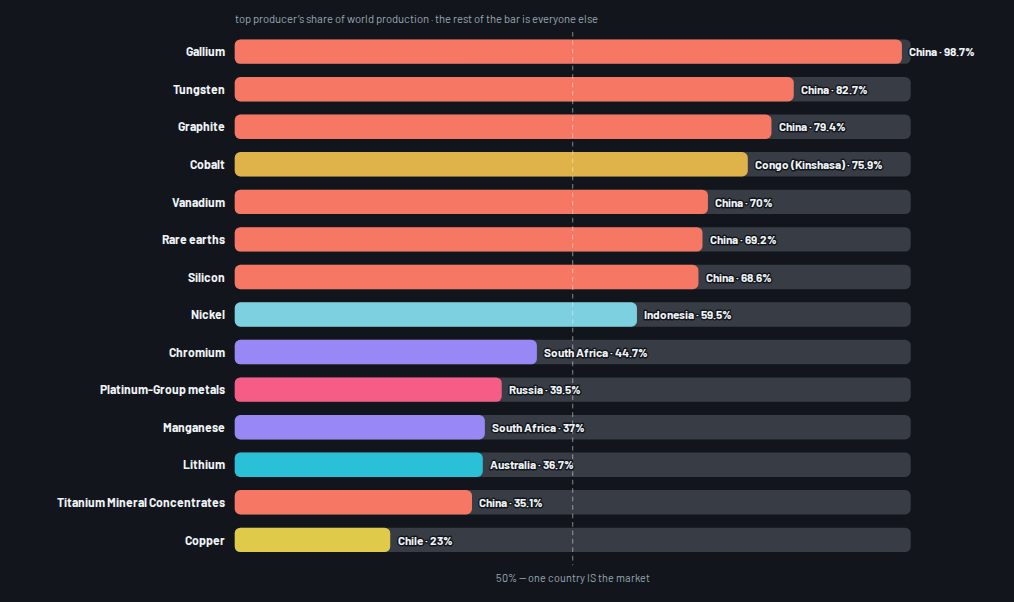 REPORTWho Holds the Periodic TableFour markets are one country.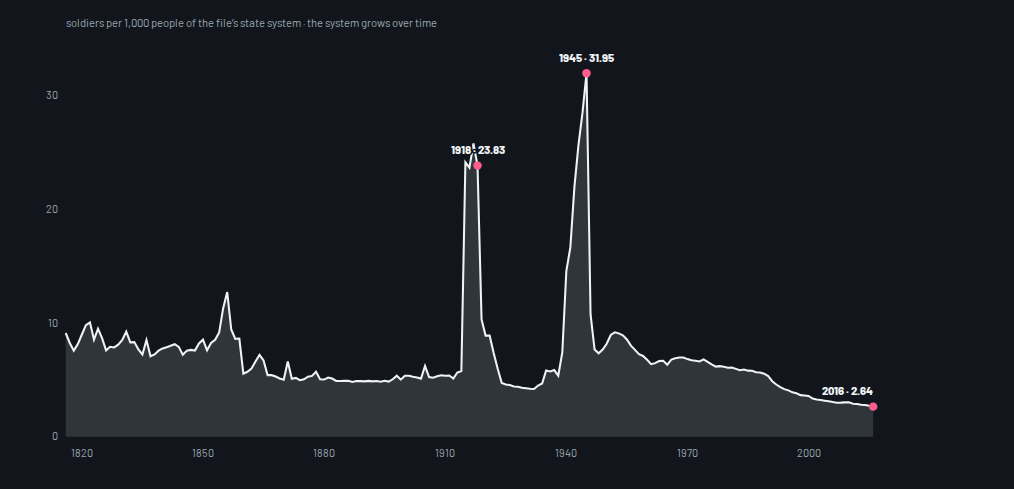
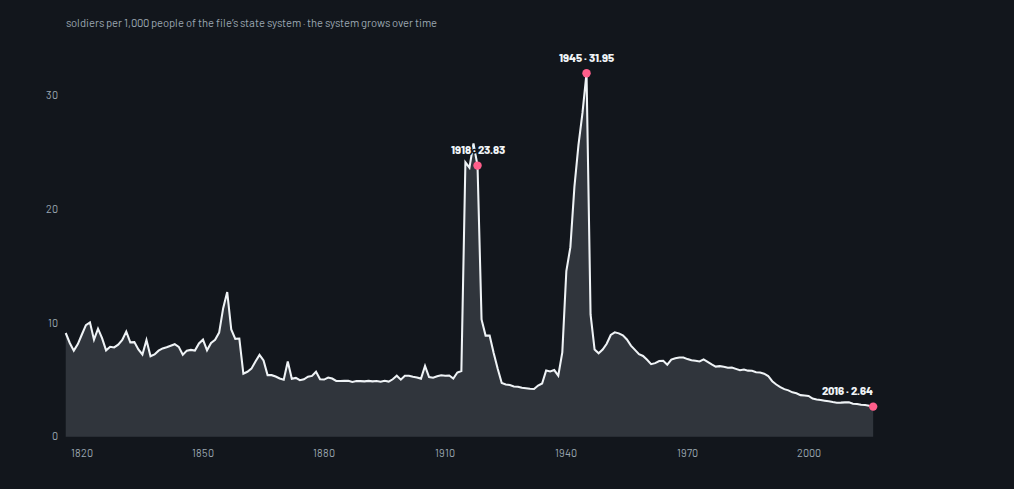 REPORTThe Standing ArmyOne person in 379.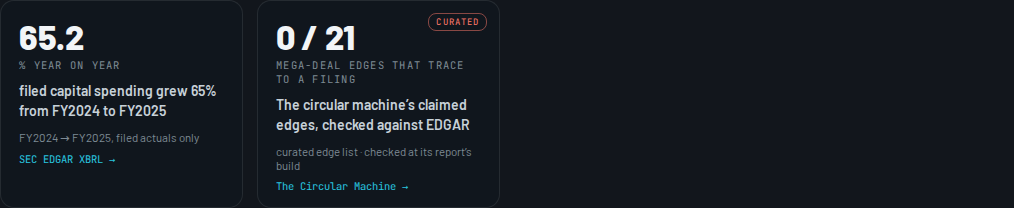
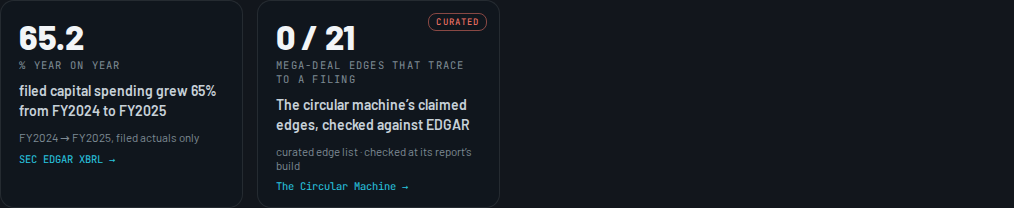 REPORTThe Pressure BoardThe money is filed; the deals are not.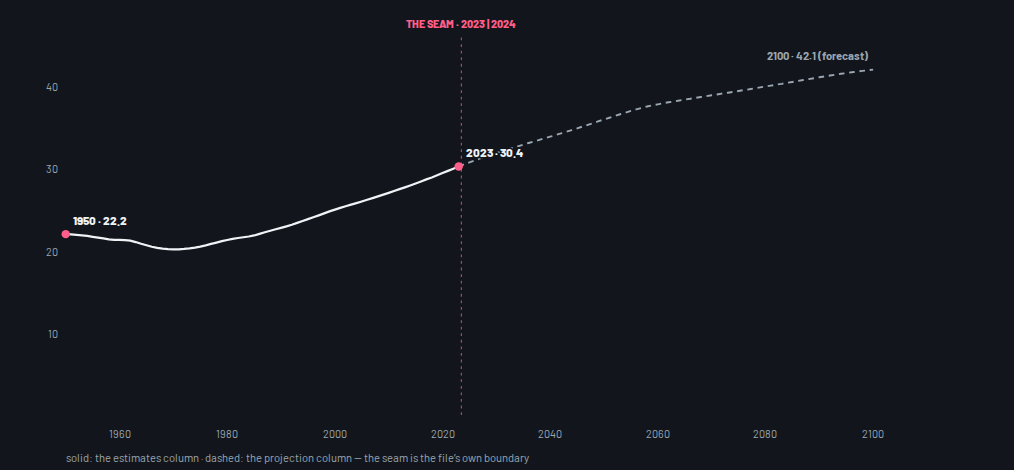
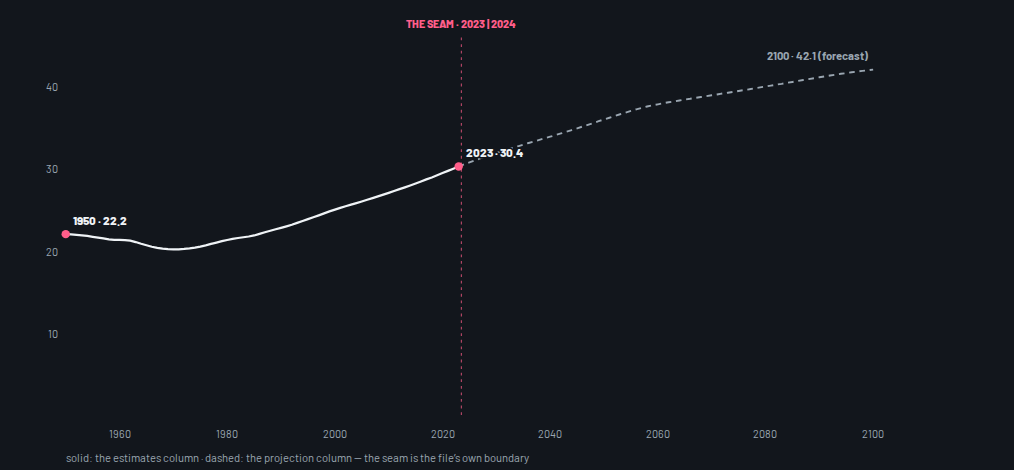 REPORTThe Old WorldJapan was younger than the world is now.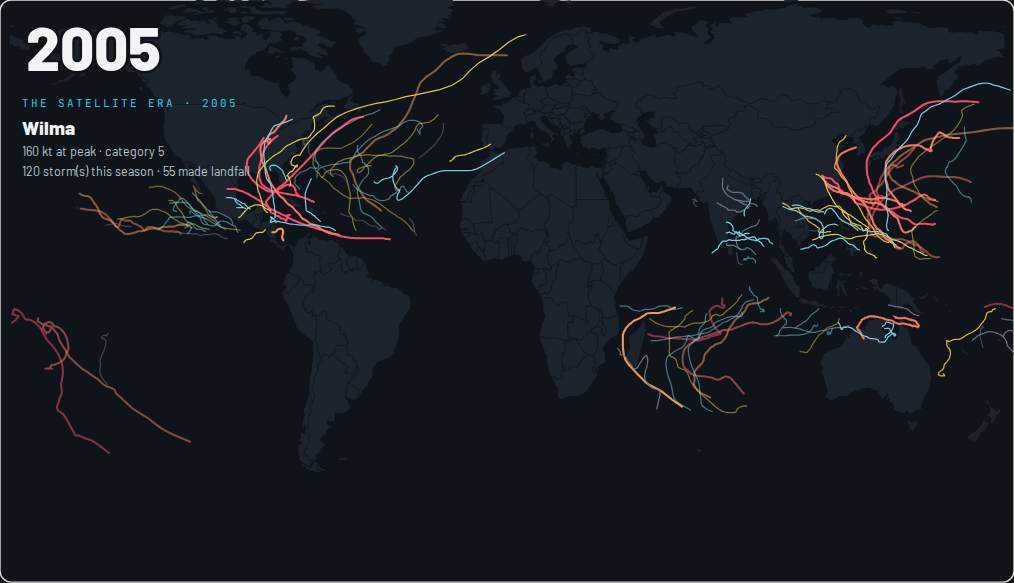
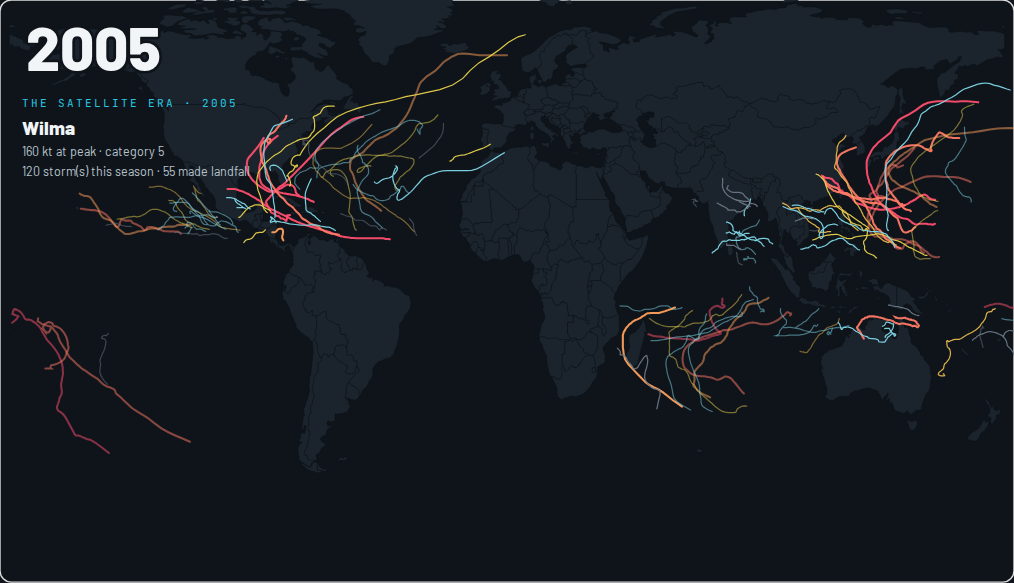 REPORTThe Names of the Storms13,584 storms, every one with a path.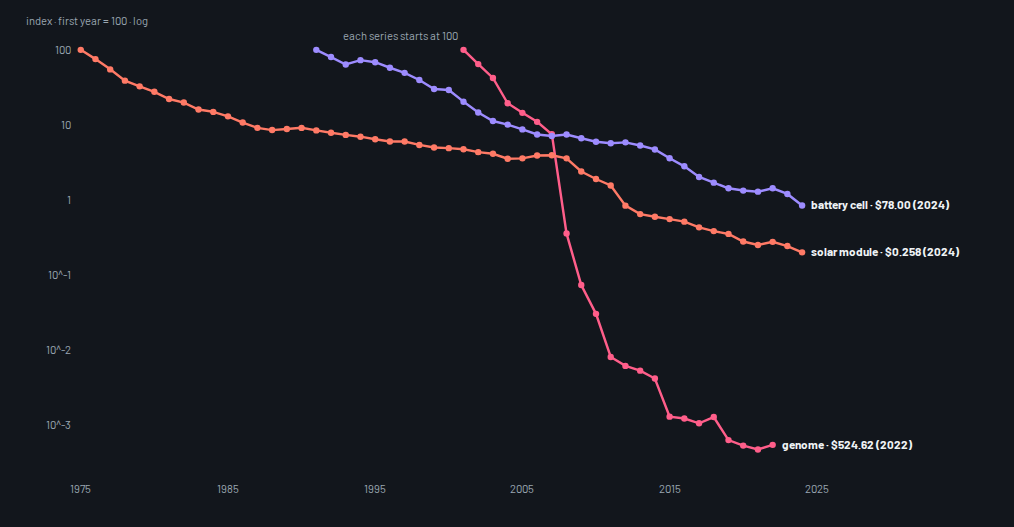
 REPORTThe Learning CurvesBiology beat Moore's law.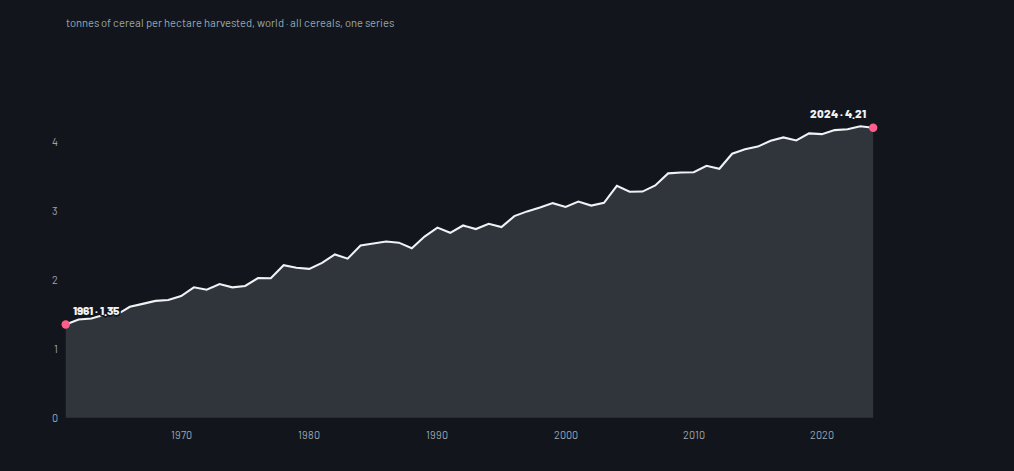
 REPORTThe Harvest3.1 times the grain from the same field.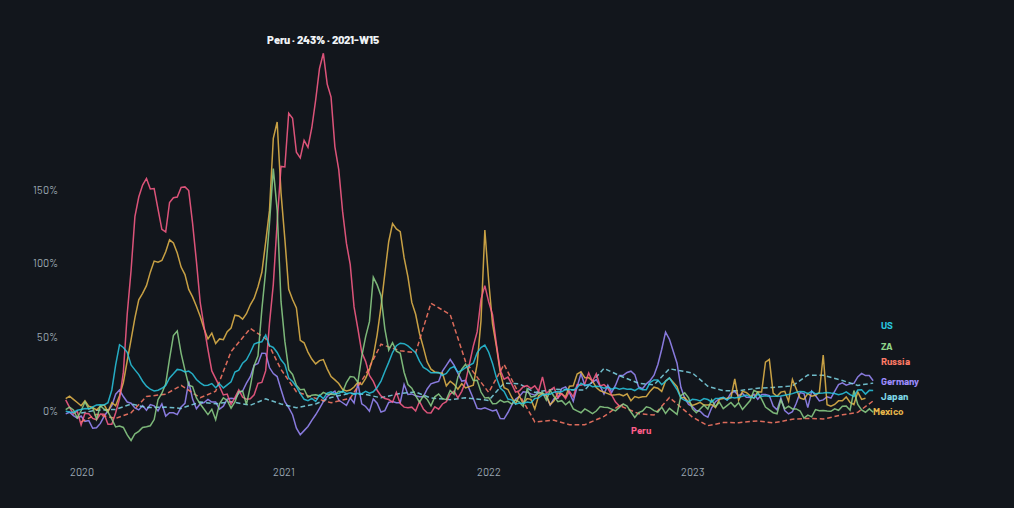
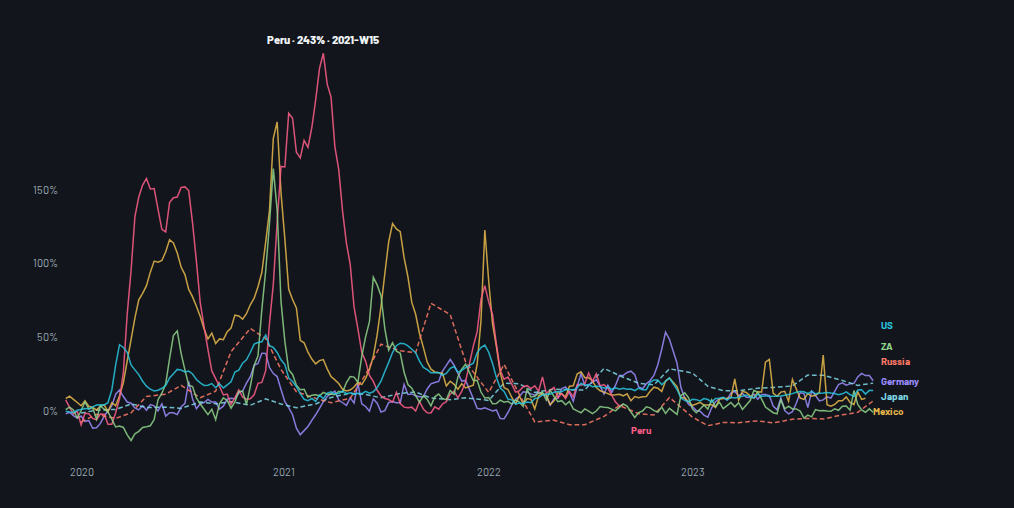 REPORTThe ExcessThe books and the graves disagree — by country.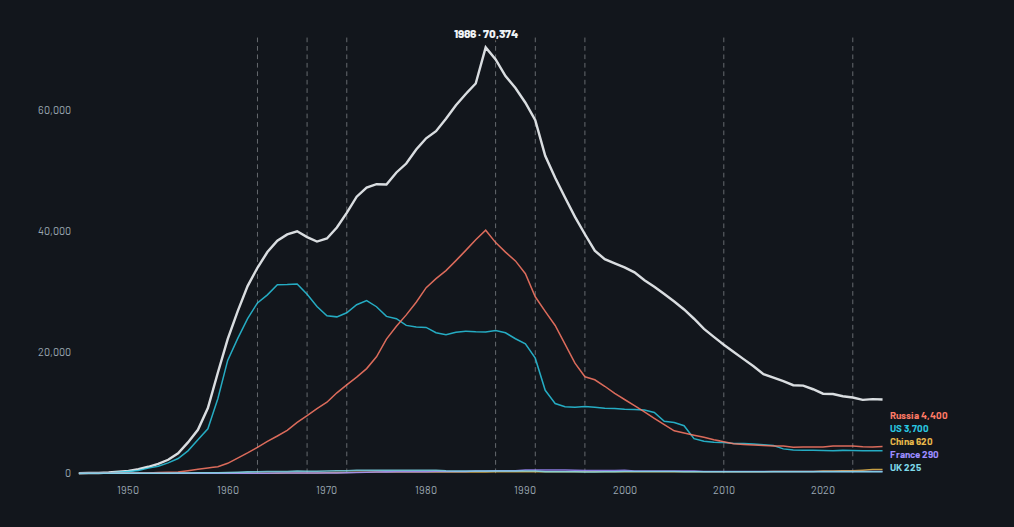
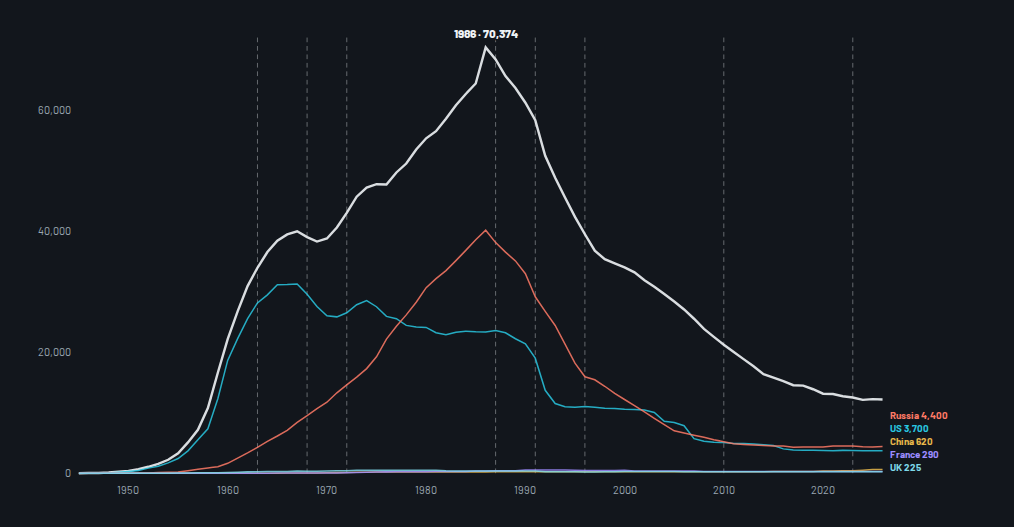 REPORTThe ArsenalThe fall has stopped.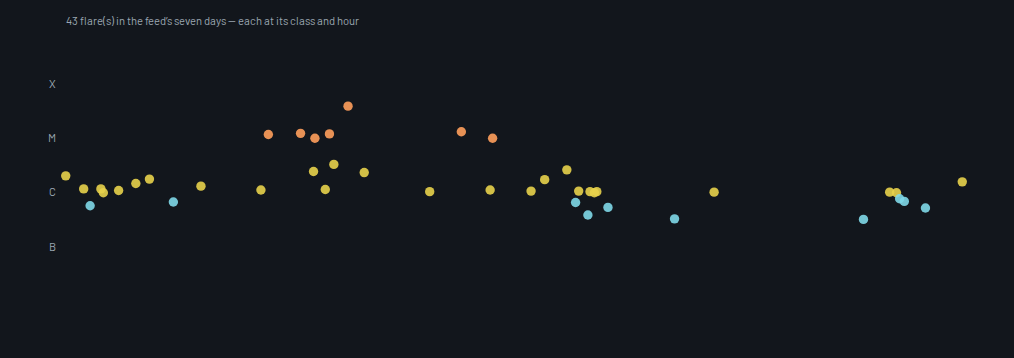
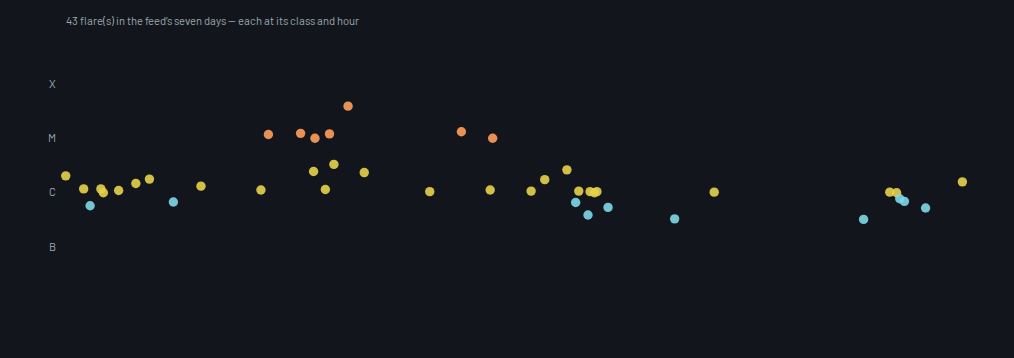 REPORTOne Day of the SunThe longest measurement humanity keeps.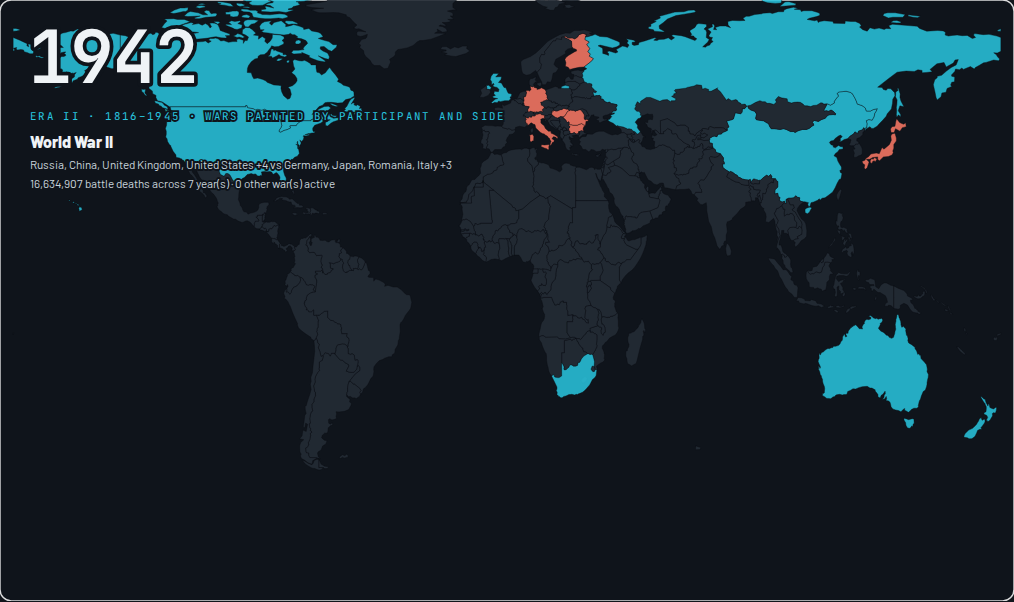
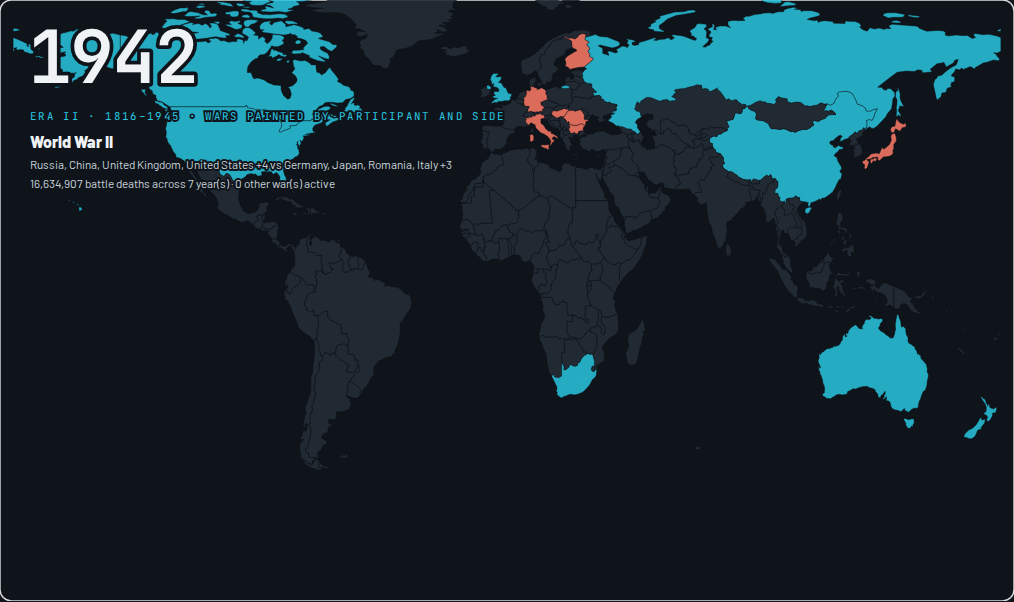 REPORTThe War RecordThe long peace is measured, not imagined.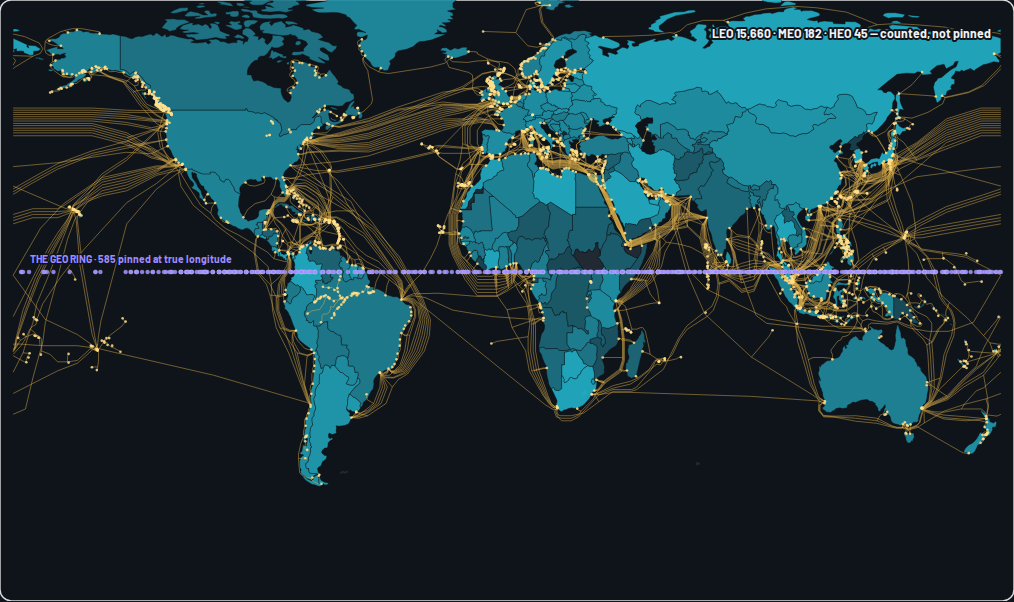
 REPORTThe Signal GridOne company is two-thirds of the sky.
 REPORTThe QueueThe queue is 1.7× the entire fleet.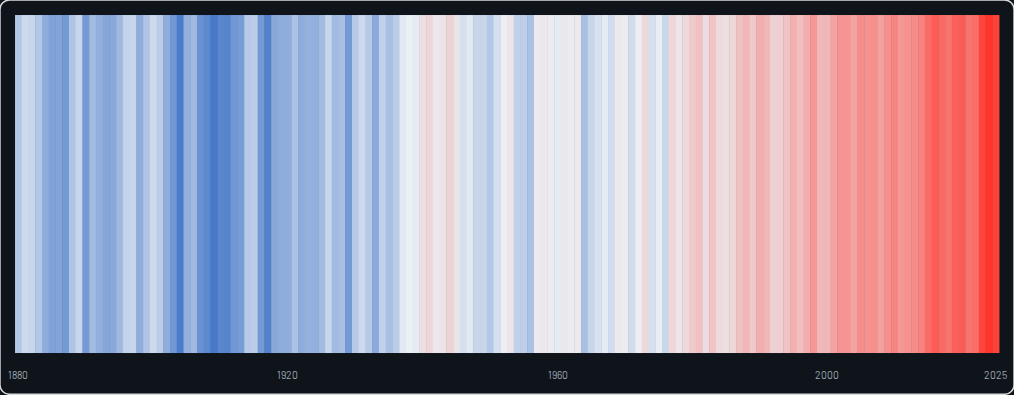
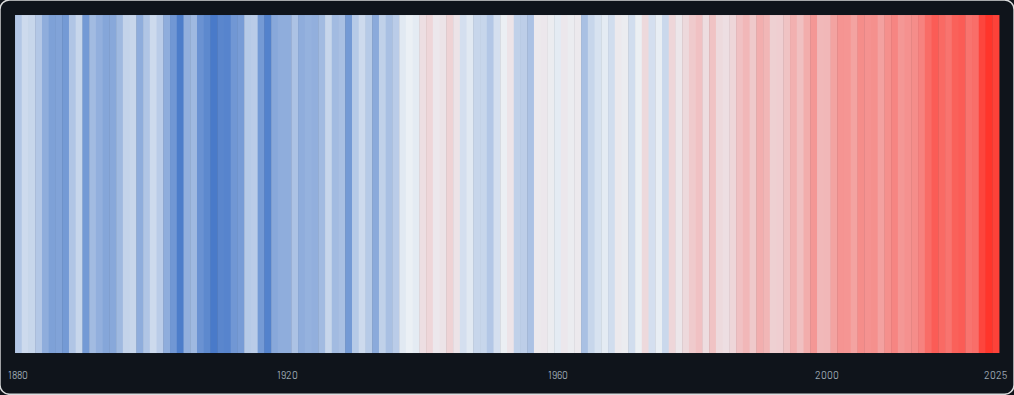 REPORTThe Warming Record1976 was the last year below the baseline.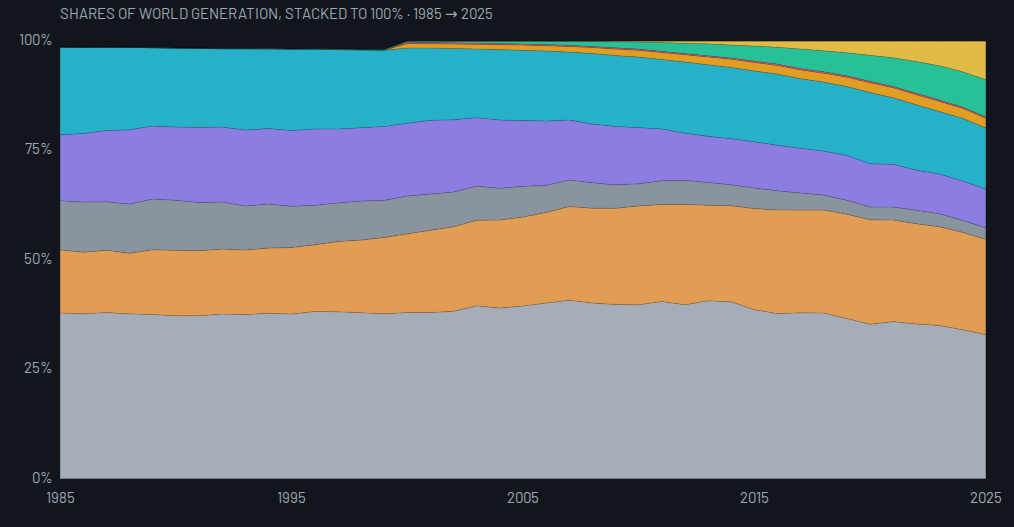
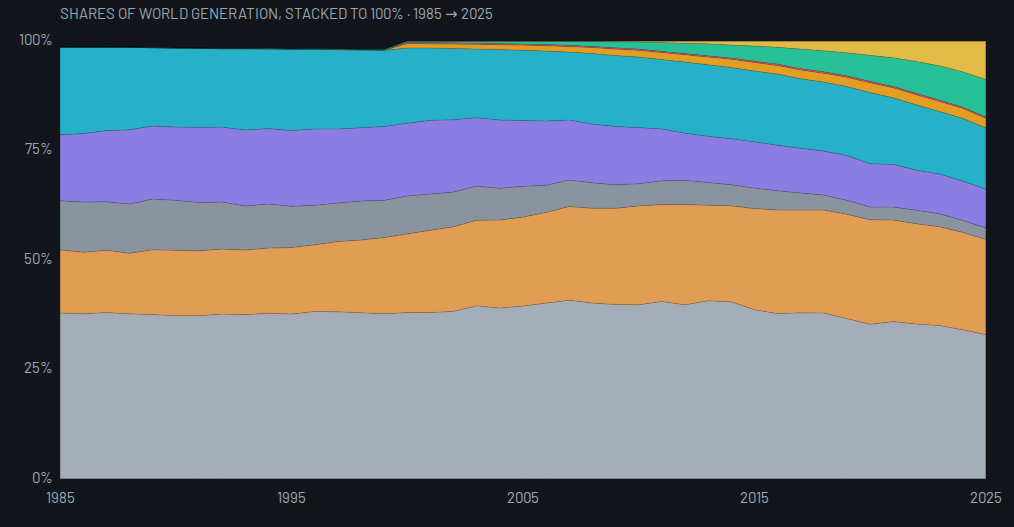 REPORTThe Power MixCoal is still a third of everything.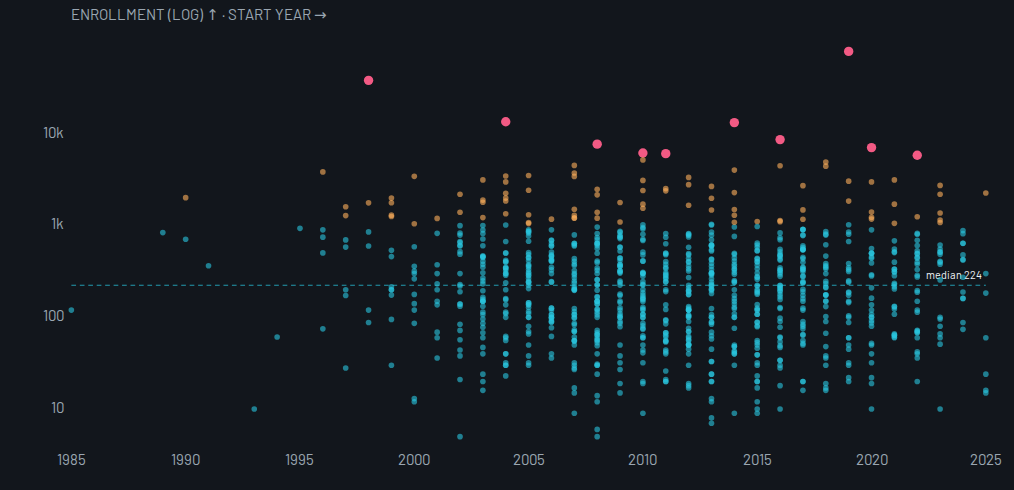
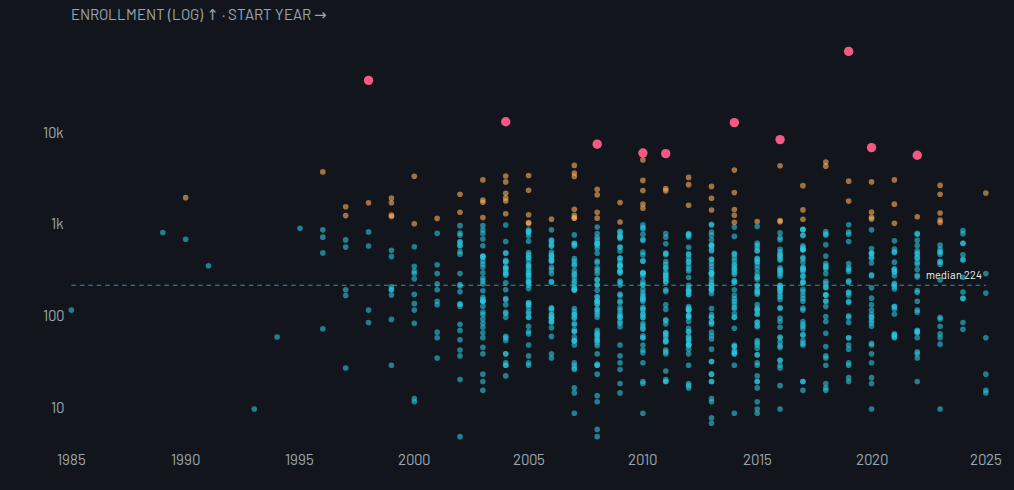 REPORTThe Phase-Three GateThe gate is smaller than its reputation.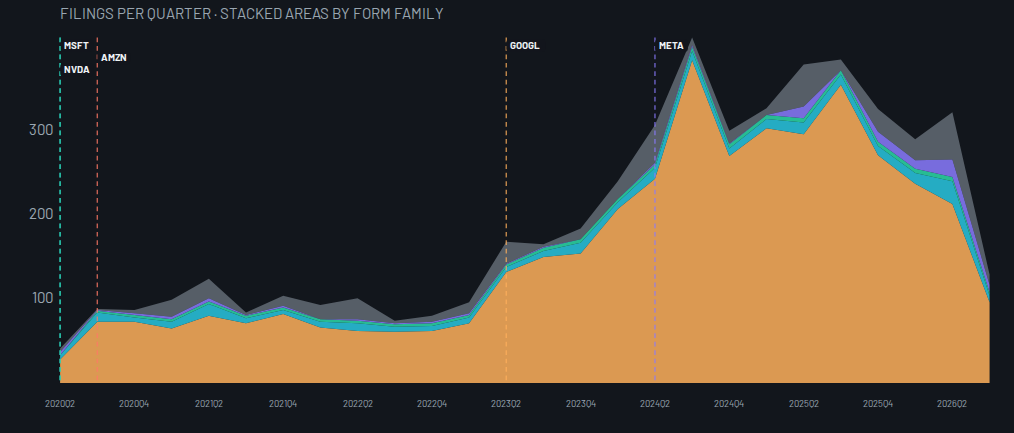
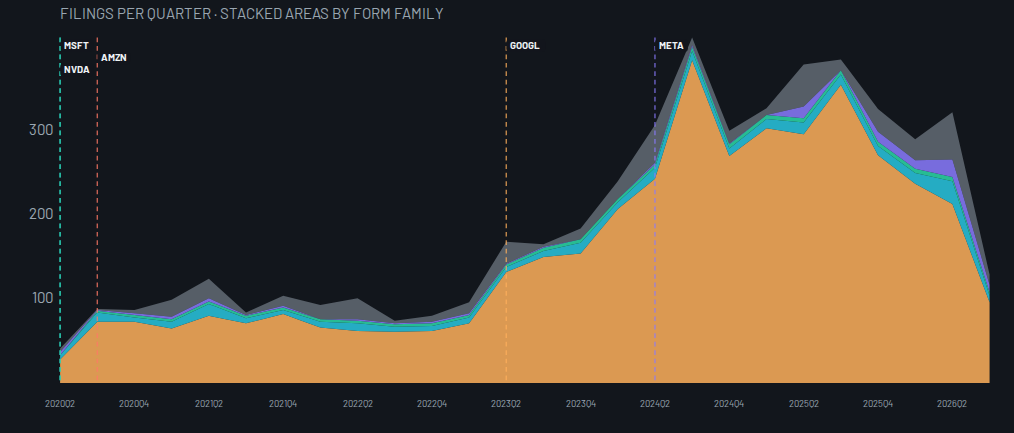 REPORTThe Paper TrailThe trail is mostly insiders.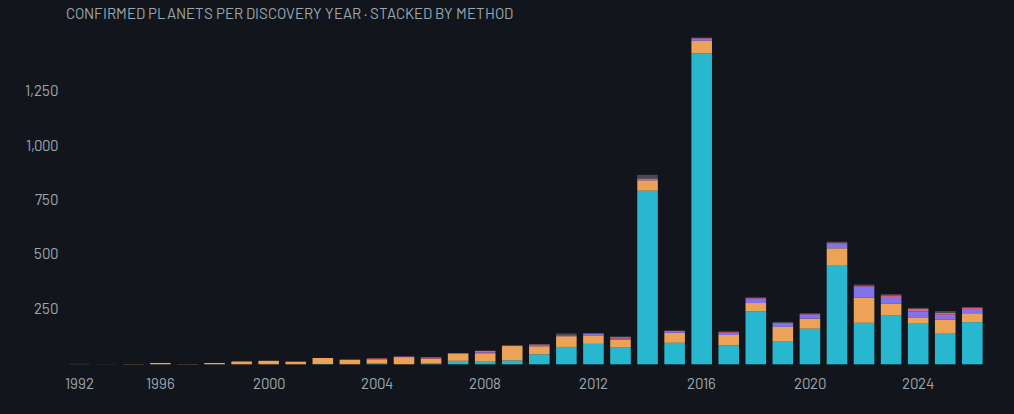
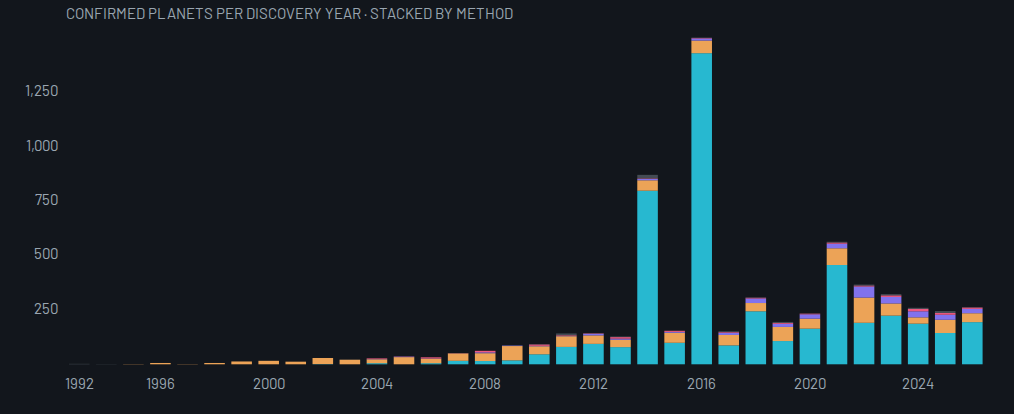 REPORTThe Other EarthsOne spacecraft found half of everything.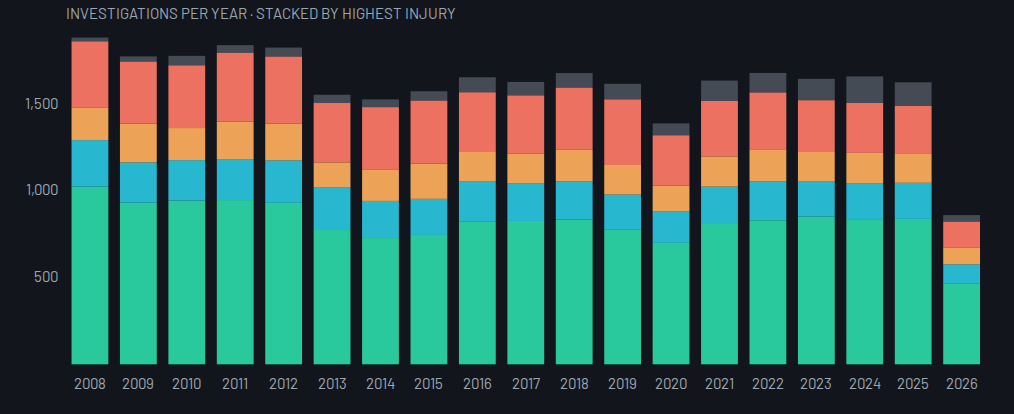
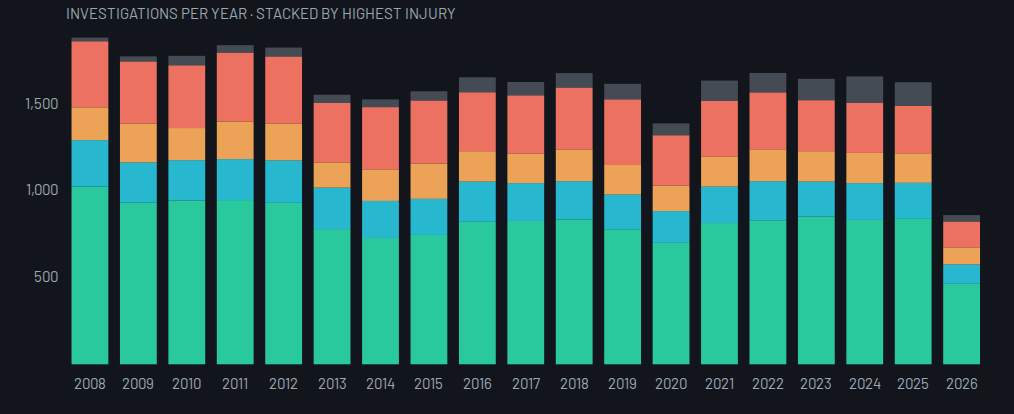 REPORTThe Fatal MarginThe survived majority is the story.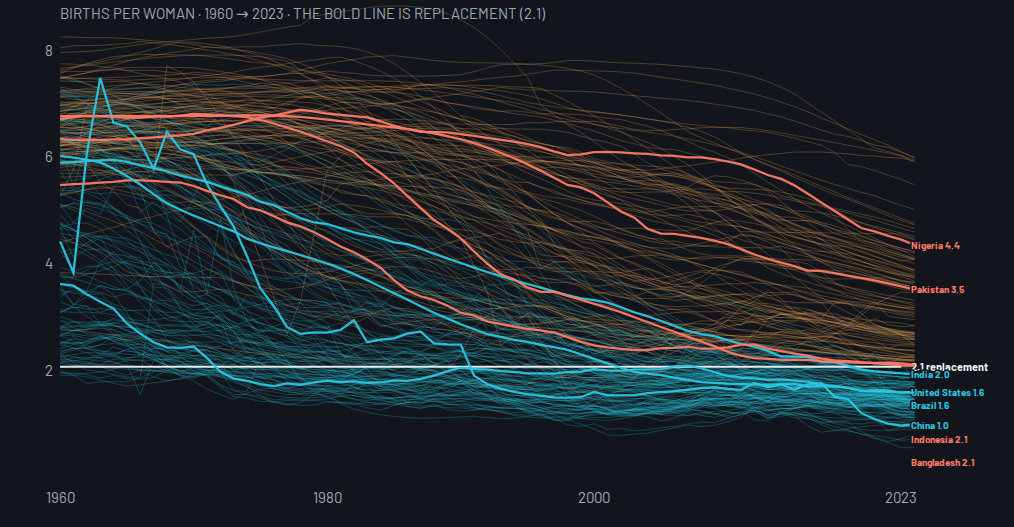
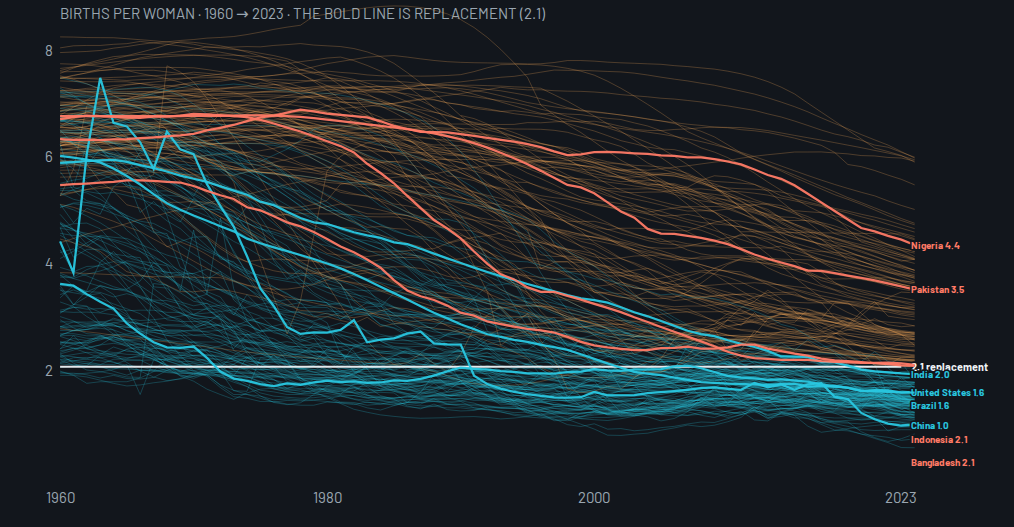 REPORTThe Demographic TurnTwo-thirds of humanity lives below replacement.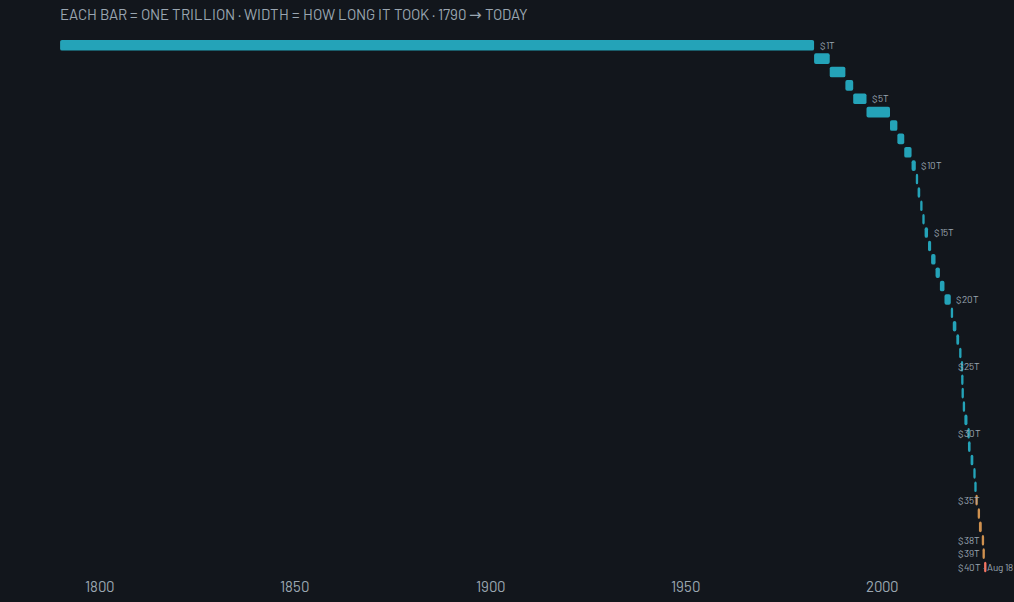
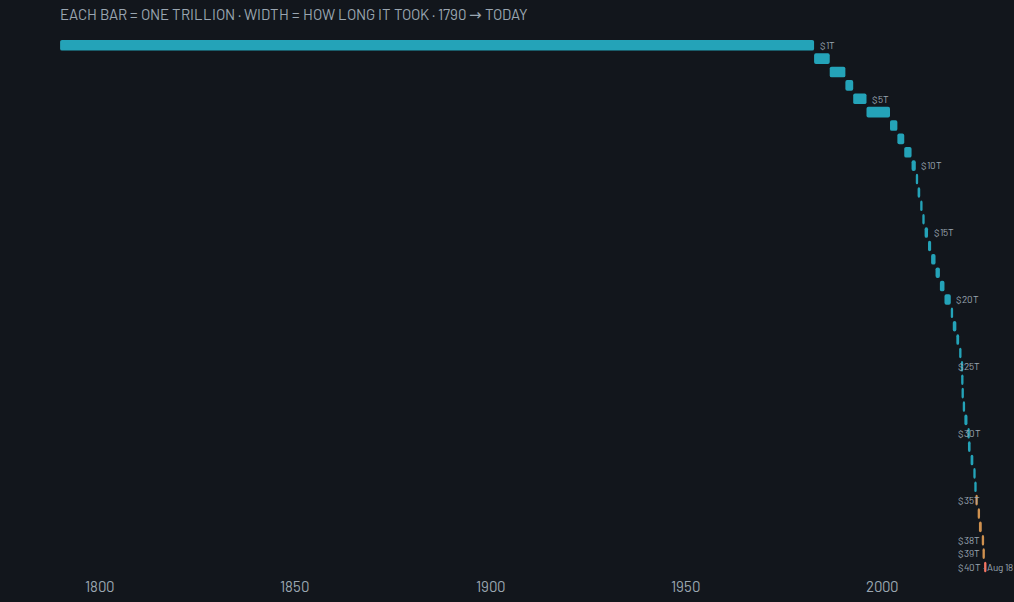 REPORTThe Debt LedgerThe fortieth trillion took 154 days.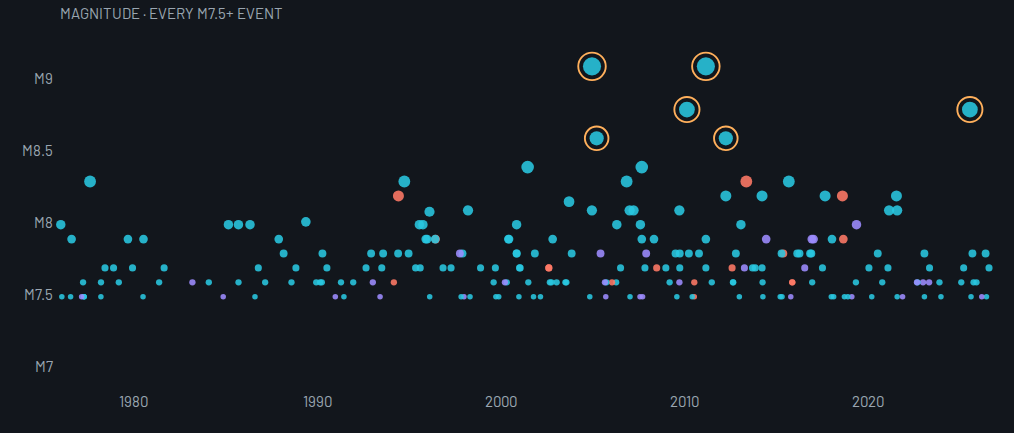
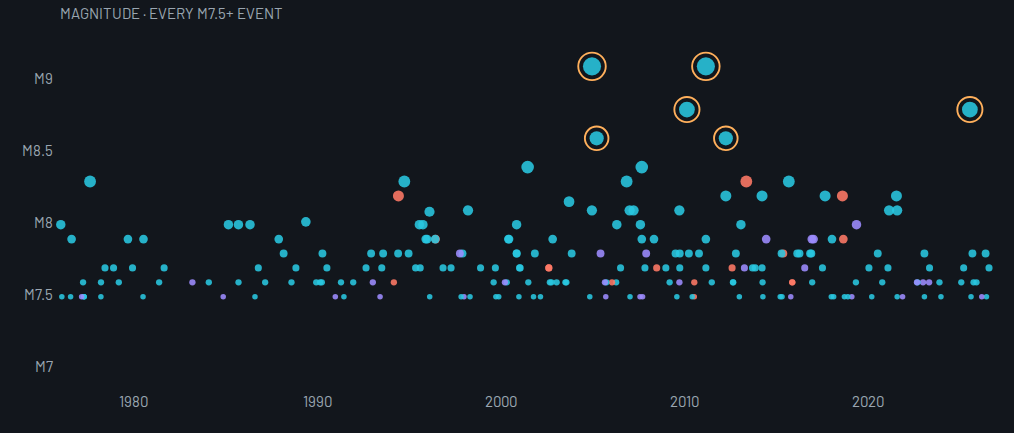 REPORTFifty Years of Big ShocksSix shocks are half the energy.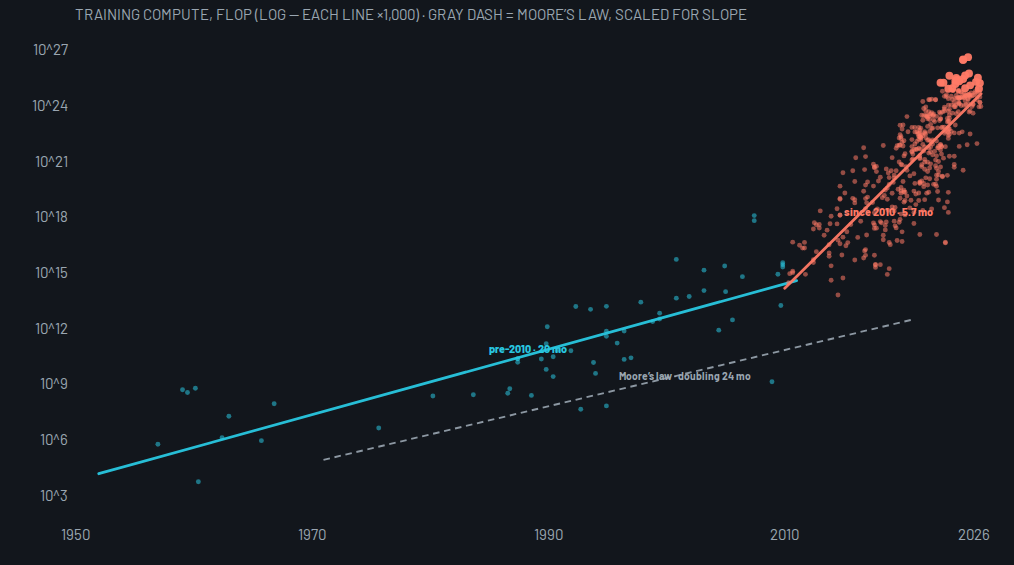
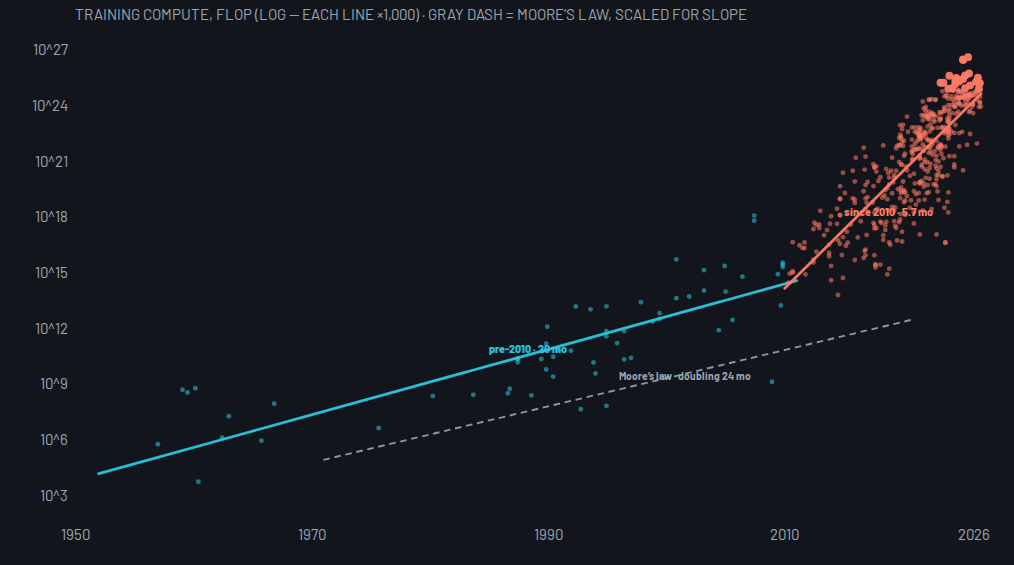 REPORTFaster than MooreIn 2010, AI left Moore's law.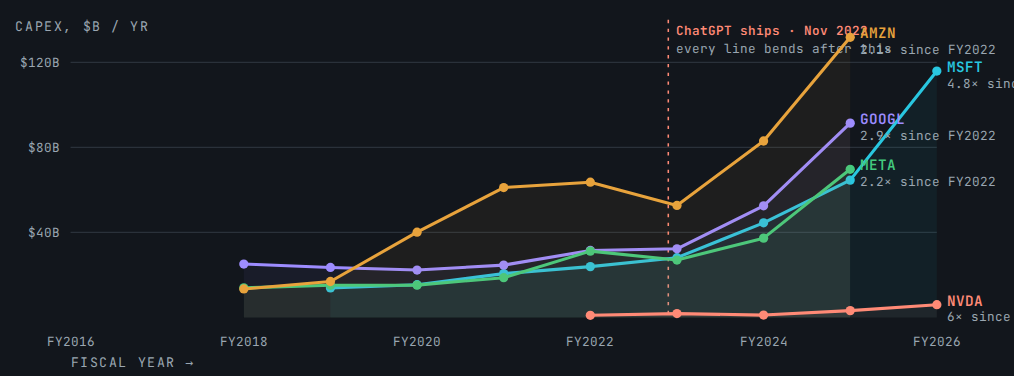
 REPORTThe AI Economy