GRIDINT RESEARCH · INSIGHTS
Short, dated, on the data.
105 findings from 28 reports — 16 edition-dated and 12 rolling (its figures move with its window). Each one opens on the exhibit it was read from, and carries the edition it was read at.
The wave is broader than tech's front row — and early 2026 was its busiest stretch.Six of the fifteen events landed in the first quarter of 2026 alone, across semiconductors, software, retail infrastructure, logistics, and apparel.The AI Layoffs Ledger · the pace, C1edition 2 · published 2026-08-27 · data cutoff 2026-08-26Open the finding →Only 35% of the tracked heads trace to a filed count.40,100 of 115,875 carry a headcount stated verbatim in a filing. The public picture of this wave is mostly built from numbers no company has put its name to.The AI Layoffs Ledger · the receipts, B1edition 2 · published 2026-08-27 · data cutoff 2026-08-26Open the finding →The single largest figure in the ledger is not a layoff count.Intel's 26,400 — 23% of all tracked heads — is press-derived from a filed end-state and explicitly includes attrition. Any total quoting it as a cut count overstates what has been filed.The AI Layoffs Ledger · the wave, A1edition 2 · published 2026-08-27 · data cutoff 2026-08-26Open the finding →The giants trim; the mid-caps amputate.Where the share is stated, megacaps cut 2–10% — while WiseTech cut 30% of its entire company in one board action. Size and depth are different stories, drawn together.The AI Layoffs Ledger · depth vs size, D1edition 2 · published 2026-08-27 · data cutoff 2026-08-26Open the finding →Announced is not effective.Where both dates are tracked, the gap between headline and last day runs from zero days to nearly three years — HP's program stretches to fiscal 2028.The AI Layoffs Ledger · the lag, E1edition 2 · published 2026-08-27 · data cutoff 2026-08-26Open the finding →Not one dollar figure in this machine comes from a filing. Capex filings corroborate the SCALE of spending, but no counterparty split is ever filed — every specific number here is press-reported, and the network's line styles say so before the reader asks.The Circular Machine · the receipts, B1edition 1 · published 2026-08-27 · data cutoff 2026-08-27Open the finding →More than half the machine has no number at all. Twelve of twenty-one relationships — including most of the return legs that make the loop a loop — are publicly acknowledged but financially undisclosed. They draw as dotted hairlines: present, real, unpriced.The Circular Machine · the machine, A1edition 1 · published 2026-08-27 · data cutoff 2026-08-27Open the finding →The headline figures are ceilings, staged and conditional. Nvidia→OpenAI ($100B, staged with buildout), OpenAI→Oracle ($300B, multi-year), SoftBank→OpenAI (round terms staged) — announcements of intent whose full values depend on futures that have not happened.The Circular Machine · the machine, A1edition 1 · published 2026-08-27 · data cutoff 2026-08-27Open the finding →Suppliers invest in their customers, and customers commit revenue to their suppliers — the same names appear on both ends of multiple edges (Nvidia↔CoreWeave, Nvidia↔xAI, Microsoft↔OpenAI). That is the circularity itself, visible as reciprocal arcs.The Circular Machine · who claims what, C1edition 1 · published 2026-08-27 · data cutoff 2026-08-27Open the finding →The climb is filed, not claimed.The five builders’ combined capex rose from $69B in FY2019 to $361B in FY2025 — 5.2× in six fiscal years, every figure carrying an accession number.The Data Center Decade · the climb, A1edition 1 · published 2026-08-27 · data cutoff 2026-08-27Open the finding →Fiscal 2023 was the dip before the sprint.Combined capex FELL 6% in FY2023 — then rose +54% and +65% in the two years after: the steepest filed growth in the window. In the filings, the AI build-out has a birthday.The Data Center Decade · the knee, B1edition 1 · published 2026-08-27 · data cutoff 2026-08-27Open the finding →Three announcements outweigh the biggest filed year.The Circular Machine’s ceilings — $100B, $300B, $30B — total $430B, more than the five builders’ combined FY2025 actuals. The announced economy is running ahead of the filed one, and only one of the two is history.The Data Center Decade · announced vs filed, C1edition 1 · published 2026-08-27 · data cutoff 2026-08-27Open the finding →The supplier spends least and catches most.Nvidia’s own filed capex peaked at $6B — against the four builders’ hundreds. The build-out’s money arrives AT the chip maker as revenue; it leaves the others as capex. That asymmetry IS the machine.The Data Center Decade · the climb, A1edition 1 · published 2026-08-27 · data cutoff 2026-08-27Open the finding →In 2010, AI left Moore's law.Training compute doubled every 20 months before 2010 — Moore's own pace — and every 5.7 months since: four times faster than the law that built its chips.Faster than Moore · the escape, A1edition 1 · published 2026-08-27 · data cutoff 2026-08 (Epoch AI database, latest)Open the finding →The frontier is 5×10²⁶.Grok 4's documented run is roughly a billion times AlexNet's 2012 training — thirteen years apart on the same field.Faster than Moore · the frontier, B1edition 1 · published 2026-08-27 · data cutoff 2026-08 (Epoch AI database, latest)Open the finding →The 10²⁵ club has 22 members — in a handful of hands.Nearly all trained since 2023, nearly all in the United States, by fewer than ten organizations.Faster than Moore · the hands, C1edition 1 · published 2026-08-27 · data cutoff 2026-08 (Epoch AI database, latest)Open the finding →Moore's law itself never bent.A steady 24-month doubling for fifty years. The escape came from capital and parallelism, not from the substrate — the receipts for that live in the capex filings.Faster than Moore · the substrate, D1edition 1 · published 2026-08-27 · data cutoff 2026-08 (Epoch AI database, latest)Open the finding →The survived majority is the story.In 51% of 30,968 investigated accidents since 2008, the highest recorded injury was NONE. The margin between accident and tragedy is the widest, least-reported number in aviation.The Fatal Margin · the margin, B1edition 1 · published 2026-08-27 · data cutoff 2026-08-26Open the finding →The record is shrinking.Investigations fell from 1,892 in 2008 to 1,633 (2025) in the last complete year — while the fatal share stayed near 20%, unmoved by the decline.The Fatal Margin · the years, A1edition 1 · published 2026-08-27 · data cutoff 2026-08-26Open the finding →Geography is exposure.CA leads the record with 2,306 events — not because its skies are dangerous, but because that is where America flies small aircraft.The Fatal Margin · where, C1edition 1 · published 2026-08-27 · data cutoff 2026-08-26Open the finding →The deadliest events are the record’s rarest.Events with ten or more deaths number just 100 in eighteen years — each one carrying its identifier in the ledger.The Fatal Margin · the ledger, E1edition 1 · published 2026-08-27 · data cutoff 2026-08-26Open the finding →Six shocks are half the energy.The M8.5+ giants — 6 events in fifty years — released 53% of everything the catalog recorded. The planet’s violence is not a murmur; it is a handful of detonations.Fifty Years of Big Shocks · the half-century, A1edition 1 · published 2026-08-27 · data cutoff 2026-08-26Open the finding →
 Two nines bracket the era.Sumatra 2004 and Tōhoku 2011 — 35% of the half-century’s energy between just the two of them. Decades are quiet or loud by whether a nine happened.Fifty Years of Big Shocks · the decades, B1edition 1 · published 2026-08-27 · data cutoff 2026-08-26Open the finding →
 The giants all live on subduction zones.Every M8.5+ event sits where ocean floor dives — Sumatra, Japan, Chile, Kamchatka. The map is a mechanism, not a scatter.Fifty Years of Big Shocks · the map, C1edition 1 · published 2026-08-27 · data cutoff 2026-08-26Open the finding →The era’s newest giant is months old.The 2025 Kamchatka M8.8 is the largest shock in over a decade — and its aftershocks are still visible in our rolling thirty-day report. The long view and the live view are one record.Fifty Years of Big Shocks · the megaquakes, D1edition 1 · published 2026-08-27 · data cutoff 2026-08-26Open the finding →The window’s record hour landed this summer.The single hottest hour of the window — 761,177 MWh of national demand — landed in July 2026, and the calendar shows this summer's hot band running wider and deeper than last year's.The Grid Under Load · the calendar, A1edition 1 · published 2026-08-27 · data cutoff 2026-08-26Open the finding →A continent breathes in unison.The heatmap's horizontal banding — cool early-UTC hours, burning evening rows — is every household and factory keeping nearly the same rhythm; the seasonal waves ride on top of a daily pulse that never breaks.The Grid Under Load · A1edition 1 · published 2026-08-27 · data cutoff 2026-08-26Open the finding →Texas is a nation-scale grid on its own.ERCOT's peak hour, 91k MWh, would rank it among the largest national grids anywhere — and its summer amplitude dwarfs its winter, the signature of an air-conditioning-driven, fast-growing system.The Grid Under Load · the multiples, B1edition 1 · published 2026-08-27 · data cutoff 2026-08-26Open the finding →Texas grows ahead — and the mid-Atlantic quietly defies the narrative.In the last full month, Texas ran +3–4% above the same month last year while the mid-Atlantic — home of the Virginia data-center corridor — came in BELOW its own prior year. The hourly record cannot separate weather from wafers, and this report says so rather than claiming it; the attribution lives in the LBNL studies on our power hub.The Grid Under Load · the index, B2edition 1 · published 2026-08-27 · data cutoff 2026-08-26Open the finding →The longest measurement humanity keeps.The sunspot count has been taken every month since 1749 — before the United States existed — and it is still taken today. This page reads the newest month live.One Day of the Sun · the cycle, B1published 2026-08-29Open the finding →The Sun has seasons, and we are in one.Eleven years, crest to crest, for twenty-five recorded cycles — and the current cycle has already outrun the forecasts made at its birth.One Day of the Sun · the cycle, B1published 2026-08-29Open the finding →Grid weather is real weather.NOAA maintains a storm scale for the power grid the way it does for hurricanes — because the star can reach the transformers. That scale is on this page, live.One Day of the Sun · now, A1published 2026-08-29Open the finding →One spacecraft found half of everything.Kepler and its K2 reprise account for 53% of all 6,354 confirmed planets — a single instrument’s field of view, stared at long enough, out-discovered the rest of astronomy combined.The Other Earths · one spacecraft, C1edition 1 · published 2026-08-27 · data cutoff 2026-08-26Open the finding →The record has eras, and they are instruments.Radial velocity owned the field’s first fifteen years; the transit method now carries 74% of the catalog. Method share is a history of telescopes, not of planets.The Other Earths · the years, A1edition 1 · published 2026-08-27 · data cutoff 2026-08-26Open the finding →
 The field’s gaps are limits, not absences.The empty lanes in period × radius — long-period small worlds above all — are where no current method sees well. The map is honest about being a map of vision.The Other Earths · the field, B1edition 1 · published 2026-08-27 · data cutoff 2026-08-26Open the finding →The story started before its famous beginning.The first confirmed planets date to 1992 — orbiting a dead star’s pulsar beam, three years before 51 Pegasi b made the field respectable.The Other Earths · the years, A1edition 1 · published 2026-08-27 · data cutoff 2026-08-26Open the finding →The trail is mostly insiders.82% of 5,004 filings are insider-trading forms — the routine of executive stock plans. The disclosure everyone imagines is a thin film on a river of paperwork.The Paper Trail · the stream, A1edition 1 · published 2026-08-27 · data cutoff 2026-08-26Open the finding →The famous filings are a sliver.8-K current reports — the filings that make headlines — are 5% of the stream; annual and quarterly reports are 2%. Counted as paper, news is rare.The Paper Trail · the mix, C1edition 1 · published 2026-08-27 · data cutoff 2026-08-26Open the finding →Filing velocity varies three-fold.META burned through its last thousand filings in 26 months; MSFT took 76 months. The window’s reach IS the speedometer.The Paper Trail · the velocity, B1edition 1 · published 2026-08-27 · data cutoff 2026-08-26Open the finding →The heaviest paper is the annual report.The stream’s biggest documents are XBRL-laden 10-Ks and proxies at 89 MB and up — format weight, not importance, and the method says so.The Paper Trail · the heaviest, D1edition 1 · published 2026-08-27 · data cutoff 2026-08-26Open the finding →The gate is smaller than its reputation.The median completed phase-3 trial enrolled 224 patients. The blockbuster image of phase three — tens of thousands of subjects — describes a tiny elite of trials, not the phase.The Phase-Three Gate · the field, A1edition 1 · published 2026-08-27 · data cutoff 2026-08-26Open the finding →The top ten trials carry 31% of all enrollment.Ten studies — one percent of the window — enrolled as many patients as the bottom 821 combined. Concentration, not scale, is the phase’s signature.The Phase-Three Gate · the mega-trials, D1edition 1 · published 2026-08-27 · data cutoff 2026-08-26Open the finding →Fifteen names run 20% of the gate.The most frequent lead sponsors are the industry’s biggest — and their strategies differ visibly: many small gates for some, few giant ones for others.The Phase-Three Gate · the sponsors, B1edition 1 · published 2026-08-27 · data cutoff 2026-08-26Open the finding →The money map is chronic disease.Rheumatoid Arthritis leads the conditions table — late-stage medicine concentrates where patients are many and treatment is lifelong.The Phase-Three Gate · the conditions, C1edition 1 · published 2026-08-27 · data cutoff 2026-08-26Open the finding →The fall has stopped.From 70,374 warheads to 12,187 in forty years — and the newest years of the record show the descent flattening, with lines turning up.The Arsenal · the stockpile, A1published 2026-08-29 · data cutoff 2026 (stockpiles)Open the finding →1962: one detonation every other day.178 detonations in twelve months — one every other day — the year before the Partial Test Ban. After 1996, the ledger falls nearly silent.The Arsenal · the tests, B1published 2026-08-29 · data cutoff 2026 (stockpiles)Open the finding →Exactly one state has ever walked away.South Africa built six, dismantled six, and left. In eighty years of this ledger, its zero is the only one anyone earned.The Arsenal · the nine, C1published 2026-08-29 · data cutoff 2026 (stockpiles)Open the finding →The fortieth trillion took 154 days.The first took 191 fiscal years. The ladder's rungs have shortened from centuries to decades to seasons — the fortieth crossed on August 18, 2026.The Debt Ledger · the ladder, A1edition 1 · published 2026-08-27 · data cutoff 2026-08-25Open the finding →$90,203 a second, around the clock.The trailing year added $2.84T — arithmetic on two ledger rows a year apart, not a projection.The Debt Ledger · the pace, C1edition 1 · published 2026-08-27 · data cutoff 2026-08-25Open the finding →Doubled, doubled, and doubled again.$5T in 1996 · $10T in 2008 · $20T in 2017 · $40T in 2026 — three doublings in thirty years, each faster in dollars than the one before.The Debt Ledger · the climb, B1edition 1 · published 2026-08-27 · data cutoff 2026-08-25Open the finding →The ledger is two ledgers.$32.3T is owed to the public — markets, funds, foreign holders — and $7.8T to the government's own trust funds. The staircase splits them.The Debt Ledger · the pace, C1edition 1 · published 2026-08-27 · data cutoff 2026-08-25Open the finding →Two-thirds of humanity lives below replacement.67.8% by 2023 population weights — up from under 2% of today's map in 1960. The turn is not coming; on the record, it has happened.The Demographic Turn · the count, B1edition 1 · published 2026-08-27 · data cutoff 2023 (latest World Bank year)Open the finding →The count only climbs.5 countries in 1960 · 42 in 1980 · 80 in 2000 · 119 in 2023. In sixty-three years of records the below-replacement count has never fallen for long.The Demographic Turn · the count, B1edition 1 · published 2026-08-27 · data cutoff 2023 (latest World Bank year)Open the finding →Iran: 7.5 to 1.7 in one lifetime.The record's steepest great fall — with Kuwait, Brunei and Costa Rica on the same slope. The fastest transitions were not in Europe.The Demographic Turn · the fallers, C1edition 1 · published 2026-08-27 · data cutoff 2023 (latest World Bank year)Open the finding →South Korea: 0.75.The lowest national fertility ever recorded in this series — at that rate each generation is about a third the size of the one before it, as arithmetic, not prophecy.The Demographic Turn · the fallers, C1edition 1 · published 2026-08-27 · data cutoff 2023 (latest World Bank year)Open the finding →The books and the graves disagree — by country.Egypt's excess ran 14.51 times its reported toll; the Philippines 4.35; Russia 3.35; the United States 1.13. The undercount is not a property of the pandemic — it is a property of the counting.The Excess · the gap, B1published 2026-08-29Open the finding →Two countries, one toll, two stories.Russia and the United States carry nearly identical excess estimates — about 1.35 million each — with officially reported tolls three times apart. Both facts, one board.The Excess · the gap, B1published 2026-08-29Open the finding →You do not need a model to see it.Set the pandemic months over the registry's own five-year range and the excess is visible to the naked eye — the raw record carries the argument without a single fitted line.The Excess · the raw record, C1published 2026-08-29Open the finding →3.1 times the grain from the same field.A world hectare gave 1.35 tonnes of cereal in 1961 and 4.21 in 2024 — a staircase of six decades whose highest step, 2023's 4.23, stands at the record's far end.The Harvest · the revolution, A1published 2026-08-29Open the finding →Half the land per person.Arable land behind each living person fell from 0.36 to 0.17 hectares while the yield line tripled — two units, two panels, and a counterfactual this page declines to compute.The Harvest · the shrinking field, B1published 2026-08-29Open the finding →The pasture peak.Grazing land — the largest human use of land on Earth — peaked at 3.28 billion hectares in 2001 and stands at 3.20 billion in 2025. The largest land use humanity has is shrinking.The Harvest · the ten thousand years, C2published 2026-08-29Open the finding →Biology beat Moore's law.The genome halved in cost every 1.04 years — a 181,585-fold collapse in 21 years. The fastest sustained price decline in the industrial record is not in silicon.The Learning Curves · the curves, A1published 2026-08-29 · data cutoff 2026-08-29Open the finding →The energy curves are slower — and unstoppable.Solar halves every 6.4 years, batteries every 4.9 — for five decades and three, respectively, through every cycle and shock in between.The Learning Curves · the frontiers, B1published 2026-08-29 · data cutoff 2026-08-29Open the finding →Launch is a scatter, not a line.61 vehicles, three classes, six decades — and the modern lower edge sits orders of magnitude below the frontier of the 1960s. The record refuses a single curve, so the report does too.The Learning Curves · the launch frontier, C1published 2026-08-29 · data cutoff 2026-08-29Open the finding →The gate does not bend.22 to 59 novel drugs a year, a decade running, while sequencing collapsed six orders of magnitude behind it. Learning curves bend prices — not institutions.The Learning Curves · the gate, D1published 2026-08-29 · data cutoff 2026-08-29Open the finding →13,584 storms, every one with a path.The ledger of the sky goes back before the telegraph — and the atlas plays all of it, from unnamed sail-era terrors to this season's lettered list.The Names of the Storms · the atlas, A1edition 1 · published 2026-08-29 · data cutoff 2026 season in progressOpen the finding →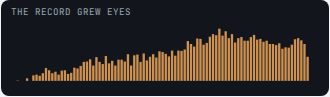
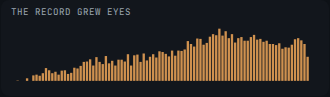 The climb is the watchers.Season counts triple across the archive — with the jumps landing exactly at aircraft reconnaissance and satellite coverage. The record grew eyes, and the exhibit says so.The Names of the Storms · the ledger, B1edition 1 · published 2026-08-29 · data cutoff 2026 season in progressOpen the finding →The coasts always kept better books.Landfall counts hold steadier than sea counts across every era — where storms meet people, the record was always surest.The Names of the Storms · the ledger, B1edition 1 · published 2026-08-29 · data cutoff 2026 season in progressOpen the finding →Japan was younger than the world is now.Japan's 1950 median was 21.3 — below the world's 2023 figure of 30.4 — and stands at 49.0 today. The world as a whole is now older than the future's oldest country was at the record's start.The Old World · the divergence, B1published 2026-08-29Open the finding →One country got younger.Nigeria's median fell from 18.1 to 17.8 across the whole record — while South Korea's rose 26.8 years and China passed the United States in 2019. The world line hides all three.The Old World · the divergence, B1published 2026-08-29Open the finding →A 45-year gap between countries.Central African Republic's median is 14.3; Vatican's is 59.6. The same column, the same year — and the widest human age gap the record holds.The Old World · the two ends, C1published 2026-08-29Open the finding →Four markets are one country.Gallium 98.7%, tungsten 82.7%, graphite 79.4% — one flag; cobalt 75.9% — another. The transition's shopping list runs through two capitals.Who Holds the Periodic Table · the ladder, A1published 2026-08-29Open the finding →The diggers and the holders disagree.Australia mines the most lithium; Chile holds the most. Zimbabwe sits on the chromium. Where the names split, the next decade's map is already drawn.Who Holds the Periodic Table · the ground, C1published 2026-08-29Open the finding →Copper is what healthy looks like — and it's 23%.The most diversified market on the list still gives its top producer nearly a quarter. Concentration is not the exception in minerals; it is the norm.Who Holds the Periodic Table · the producers, B1published 2026-08-29Open the finding →Coal is still a third of everything.33% of world generation in 2025 — against 38% in 1985. Forty years of energy transition have so far changed coal's share by five points.The Power Mix · the mix, A1edition 1 · published 2026-08-27 · data cutoff 2025 (latest full year in the record)Open the finding →Solar caught nuclear in 2025.From 32 TWh in 2010 to 2,779 TWh — an 86-fold climb in fifteen years, to within a rounding error of the technology that had a fifty-year head start.The Power Mix · the machines, B1edition 1 · published 2026-08-27 · data cutoff 2025 (latest full year in the record)Open the finding →
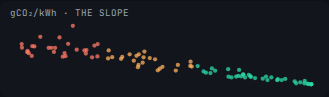 The mix writes the carbon number.41 gCO₂/kWh in France (69% nuclear) · 525 in China · 1,000 in Uzbekistan — a 24-fold spread that maps almost perfectly onto the low-carbon share.The Power Mix · the consequence, C1edition 1 · published 2026-08-27 · data cutoff 2025 (latest full year in the record)Open the finding →The 163-fold divide.Norway draws 28,598 kWh per person per year; Nigeria 175. Half the story of world power is who has it.The Power Mix · the divide, D1edition 1 · published 2026-08-27 · data cutoff 2025 (latest full year in the record)Open the finding →The money is filed; the deals are not.Capital spending grew 65% year on year in the filings themselves — while zero of the twenty-one publicly claimed mega-deals traces to a filing. Both true, on one board.The Pressure Board · the collision, B1published 2026-08-29Open the finding →The wedge meets a machine at full stretch.Data centers may need 17–46 GW of new around-the-clock power by 2028; the best build year in the modern record delivered 57 — once, for everything at once.The Pressure Board · the collision, B1published 2026-08-29Open the finding →The line grows ten times faster than it clears.890 GW entered the interconnection queues in one year. History builds 14.8% of what enters. Neither number bends the other.The Pressure Board · the collision, B1published 2026-08-29Open the finding →The queue is 1.7× the entire fleet.2,363 GW are waiting for a grid connection — against 1,405 GW operating. America's power problem is not ambition; it is the line at the door.The Queue · the queue, B1published 2026-08-28 · data cutoff 2026-08-28Open the finding →Fifteen cents on the dollar.Of the 2,613 GW that entered the queue 2000–2018, 14.8% reached operation and 76.9% withdrew — after a median 3.1 years in line. The queue is where capacity waits, and mostly where it dies.The Queue · the queue, B1published 2026-08-28 · data cutoff 2026-08-28Open the finding →2025 set the record the decade must repeat.57 GW entered service — the biggest year since the 2002 gas boom's 70. The planned list promises 286 GW more; history says treat every date on it as an opening bid.The Queue · the build rate, C1published 2026-08-28 · data cutoff 2026-08-28Open the finding →The floor clears; the ceiling doesn't.At LBNL's low case the wedge is absorbed with room to spare. At its high case the planned list falls short under every slippage scenario — and the shortfall lands hardest where the queue is thickest.The Queue · the verdict, D1published 2026-08-28 · data cutoff 2026-08-28Open the finding →One company is two-thirds of the sky.11,042 of 16,472 active satellites are Starlink — 67%, launched almost entirely since 2019. The space age's population chart is now a corporate chart.The Signal Grid · the swarm, B1published 2026-08-28 · data cutoff 2026-08-28Open the finding →
 The ring stands still — so we pinned it.585 geostationary satellites mapped at their true longitudes, computed from the orbital record itself. The crowded arcs sit over the meridians the traffic pays for.The Signal Grid · the strata, A1published 2026-08-28 · data cutoff 2026-08-28Open the finding →A few thousand drive; twelve thousand drink.2,655 content networks against 12,384 eyeball networks — the registry's own census of upstream and downstream — meeting in 1,320 exchanges, São Paulo's the largest on Earth.The Signal Grid · the flow, C1published 2026-08-28 · data cutoff 2026-08-28Open the finding →The catalogs admit 24.The public military group holds 24 active satellites — and 3,992 more carry no public purpose at all. What the record cannot classify, this page counts rather than invents.The Signal Grid · the listening layer, D1published 2026-08-28 · data cutoff 2026-08-28Open the finding →One person in 379.In 1945, one person in 31 alive was under arms. In 2016, one in 379. The armed share of humanity fell by a factor of twelve from its summit — the lowest armed share the two-century record holds.The Standing Army · the long line, A1published 2026-08-29Open the finding →Fewer soldiers, dearer each.From 1988 to 2016 the armed share fell from 5.64 to 2.64 per 1,000 while spending per soldier rose from $61,292 to $99,581 — the same years, opposite directions, two units this page declines to merge.The Standing Army · the divergence, B1published 2026-08-29Open the finding →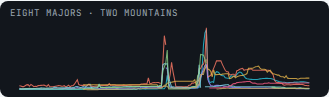
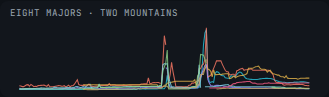 Every giant is a former giant.All eight majors' largest armies are decades past — 5 peaked in 1945 alone. The biggest force standing in the file's last year, China's 2,333 thousand, is less than a fifth of the column's all-time high.The Standing Army · the majors, C1published 2026-08-29Open the finding →The long peace is measured, not imagined.The death rate of the last eighty years sits — below the six-century median — and the line, not this sentence, carries the claim.The War Record · the long line, A2edition 1 · published 2026-08-28 · data cutoff 2024 (latest UCDP year)Open the finding →War changed species.Interstate war is 12.1% of recorded conflict deaths since 1989 — the modern record is civil war and violence against civilians. 2022 broke the pattern.The War Record · the shape, B1edition 1 · published 2026-08-28 · data cutoff 2024 (latest UCDP year)Open the finding →Two wars dwarf two centuries.The World Wars carry 79% of all battle deaths on the mapped record since 1816 — the house's concentration pattern, at its darkest.The War Record · the atlas, A1edition 1 · published 2026-08-28 · data cutoff 2024 (latest UCDP year)Open the finding →Every oil shock has a war at its door.1973 · 1979 · 1990 · 2022 — the flags sit on the price line itself. The direction of cause runs price←war, and the page says so.The War Record · the correlates, C1edition 1 · published 2026-08-28 · data cutoff 2024 (latest UCDP year)Open the finding →1976 was the last year below the baseline.49 consecutive years have now come in above the 1951–1980 mean — a streak longer than most working lifetimes.The Warming Record · the stripes, A1edition 1 · published 2026-08-27 · data cutoff 2026-07 (latest complete month)Open the finding →The three hottest years are the last three.2024 (+1.28°C), then 2025 and 2023 — the record's entire podium sits inside the most recent three years of a 146-year series.The Warming Record · the staircase, B1edition 1 · published 2026-08-27 · data cutoff 2026-07 (latest complete month)Open the finding →Seven steps up, none down.Every completed decade since the 1950s has been warmer than the decade before it — the staircase is monotonic for seventy years.The Warming Record · the staircase, B1edition 1 · published 2026-08-27 · data cutoff 2026-07 (latest complete month)Open the finding →September 2023: +1.48°C, the field's deepest cell.The hottest single month against its baseline in 1,759 measured months — inside the 2023–2025 column that darkens the whole field's edge.The Warming Record · the months, C1edition 1 · published 2026-08-27 · data cutoff 2026-07 (latest complete month)Open the finding →One event owns the month.The M7.7 near Ende, Indonesia released 64% of the entire window's seismic energy by itself — hundreds of smaller shocks barely register beside it. Magnitude is a log scale, and the energy budget exhibit makes that violence visible.Thirty Days of Earth · the energy budget, B2published 2026-08-27 · data cutoff 2026-08-27Open the finding →What the famous arcs actually carried.Japan, the Kamchatka–Kuril arc, and the Alaska–Aleutians carried 11% of the month's M4.5+ events yet only 1% of its energy — because this window's giant struck the Flores arc instead. Busy is not violent, and the hotspot compare draws exactly that disagreement.Thirty Days of Earth · hotspots, C4published 2026-08-27 · data cutoff 2026-08-27Open the finding →
 Depth is structure, not noise.26 shocks struck deeper than 300 km, and they are not scattered — they stack into the Tonga–Fiji column where the Pacific floor dives into the mantle. A month of records is enough to see the planet's plumbing.Thirty Days of Earth · the section, B3published 2026-08-27 · data cutoff 2026-08-27Open the finding →The tsunami layer's finding is a zero, and it says so.0 of 637 quakes this window carry the USGS tsunami flag — the 7.7 included. The layer stays on the map reporting its zero, because absence stated is data and absence hidden is a lie of omission.Thirty Days of Earth · the map, A1published 2026-08-27 · data cutoff 2026-08-27Open the finding →What NASA watches most is fire.1,299 of 1,374 tracked natural events are wildfires — a count of tracked incidents, not burned area, and the method says so — with floods riding the monsoon belt a distant second.Thirty Days of Earth · the map layers, A1published 2026-08-27 · data cutoff 2026-08-27Open the finding →
Two nines bracket the era.Sumatra 2004 and Tōhoku 2011 — 35% of the half-century’s energy between just the two of them. Decades are quiet or loud by whether a nine happened.Fifty Years of Big Shocks · the decades, B1edition 1 · published 2026-08-27 · data cutoff 2026-08-26Open the finding →The giants all live on subduction zones.Every M8.5+ event sits where ocean floor dives — Sumatra, Japan, Chile, Kamchatka. The map is a mechanism, not a scatter.Fifty Years of Big Shocks · the map, C1edition 1 · published 2026-08-27 · data cutoff 2026-08-26Open the finding →The era’s newest giant is months old.The 2025 Kamchatka M8.8 is the largest shock in over a decade — and its aftershocks are still visible in our rolling thirty-day report. The long view and the live view are one record.Fifty Years of Big Shocks · the megaquakes, D1edition 1 · published 2026-08-27 · data cutoff 2026-08-26Open the finding →The window’s record hour landed this summer.The single hottest hour of the window — 761,177 MWh of national demand — landed in July 2026, and the calendar shows this summer's hot band running wider and deeper than last year's.The Grid Under Load · the calendar, A1edition 1 · published 2026-08-27 · data cutoff 2026-08-26Open the finding →A continent breathes in unison.The heatmap's horizontal banding — cool early-UTC hours, burning evening rows — is every household and factory keeping nearly the same rhythm; the seasonal waves ride on top of a daily pulse that never breaks.The Grid Under Load · A1edition 1 · published 2026-08-27 · data cutoff 2026-08-26Open the finding →Texas is a nation-scale grid on its own.ERCOT's peak hour, 91k MWh, would rank it among the largest national grids anywhere — and its summer amplitude dwarfs its winter, the signature of an air-conditioning-driven, fast-growing system.The Grid Under Load · the multiples, B1edition 1 · published 2026-08-27 · data cutoff 2026-08-26Open the finding →Texas grows ahead — and the mid-Atlantic quietly defies the narrative.In the last full month, Texas ran +3–4% above the same month last year while the mid-Atlantic — home of the Virginia data-center corridor — came in BELOW its own prior year. The hourly record cannot separate weather from wafers, and this report says so rather than claiming it; the attribution lives in the LBNL studies on our power hub.The Grid Under Load · the index, B2edition 1 · published 2026-08-27 · data cutoff 2026-08-26Open the finding →The longest measurement humanity keeps.The sunspot count has been taken every month since 1749 — before the United States existed — and it is still taken today. This page reads the newest month live.One Day of the Sun · the cycle, B1published 2026-08-29Open the finding →The Sun has seasons, and we are in one.Eleven years, crest to crest, for twenty-five recorded cycles — and the current cycle has already outrun the forecasts made at its birth.One Day of the Sun · the cycle, B1published 2026-08-29Open the finding →Grid weather is real weather.NOAA maintains a storm scale for the power grid the way it does for hurricanes — because the star can reach the transformers. That scale is on this page, live.One Day of the Sun · now, A1published 2026-08-29Open the finding →One spacecraft found half of everything.Kepler and its K2 reprise account for 53% of all 6,354 confirmed planets — a single instrument’s field of view, stared at long enough, out-discovered the rest of astronomy combined.The Other Earths · one spacecraft, C1edition 1 · published 2026-08-27 · data cutoff 2026-08-26Open the finding →The record has eras, and they are instruments.Radial velocity owned the field’s first fifteen years; the transit method now carries 74% of the catalog. Method share is a history of telescopes, not of planets.The Other Earths · the years, A1edition 1 · published 2026-08-27 · data cutoff 2026-08-26Open the finding →The field’s gaps are limits, not absences.The empty lanes in period × radius — long-period small worlds above all — are where no current method sees well. The map is honest about being a map of vision.The Other Earths · the field, B1edition 1 · published 2026-08-27 · data cutoff 2026-08-26Open the finding →The story started before its famous beginning.The first confirmed planets date to 1992 — orbiting a dead star’s pulsar beam, three years before 51 Pegasi b made the field respectable.The Other Earths · the years, A1edition 1 · published 2026-08-27 · data cutoff 2026-08-26Open the finding →The trail is mostly insiders.82% of 5,004 filings are insider-trading forms — the routine of executive stock plans. The disclosure everyone imagines is a thin film on a river of paperwork.The Paper Trail · the stream, A1edition 1 · published 2026-08-27 · data cutoff 2026-08-26Open the finding →The famous filings are a sliver.8-K current reports — the filings that make headlines — are 5% of the stream; annual and quarterly reports are 2%. Counted as paper, news is rare.The Paper Trail · the mix, C1edition 1 · published 2026-08-27 · data cutoff 2026-08-26Open the finding →Filing velocity varies three-fold.META burned through its last thousand filings in 26 months; MSFT took 76 months. The window’s reach IS the speedometer.The Paper Trail · the velocity, B1edition 1 · published 2026-08-27 · data cutoff 2026-08-26Open the finding →The heaviest paper is the annual report.The stream’s biggest documents are XBRL-laden 10-Ks and proxies at 89 MB and up — format weight, not importance, and the method says so.The Paper Trail · the heaviest, D1edition 1 · published 2026-08-27 · data cutoff 2026-08-26Open the finding →The gate is smaller than its reputation.The median completed phase-3 trial enrolled 224 patients. The blockbuster image of phase three — tens of thousands of subjects — describes a tiny elite of trials, not the phase.The Phase-Three Gate · the field, A1edition 1 · published 2026-08-27 · data cutoff 2026-08-26Open the finding →The top ten trials carry 31% of all enrollment.Ten studies — one percent of the window — enrolled as many patients as the bottom 821 combined. Concentration, not scale, is the phase’s signature.The Phase-Three Gate · the mega-trials, D1edition 1 · published 2026-08-27 · data cutoff 2026-08-26Open the finding →Fifteen names run 20% of the gate.The most frequent lead sponsors are the industry’s biggest — and their strategies differ visibly: many small gates for some, few giant ones for others.The Phase-Three Gate · the sponsors, B1edition 1 · published 2026-08-27 · data cutoff 2026-08-26Open the finding →The money map is chronic disease.Rheumatoid Arthritis leads the conditions table — late-stage medicine concentrates where patients are many and treatment is lifelong.The Phase-Three Gate · the conditions, C1edition 1 · published 2026-08-27 · data cutoff 2026-08-26Open the finding →The fall has stopped.From 70,374 warheads to 12,187 in forty years — and the newest years of the record show the descent flattening, with lines turning up.The Arsenal · the stockpile, A1published 2026-08-29 · data cutoff 2026 (stockpiles)Open the finding →1962: one detonation every other day.178 detonations in twelve months — one every other day — the year before the Partial Test Ban. After 1996, the ledger falls nearly silent.The Arsenal · the tests, B1published 2026-08-29 · data cutoff 2026 (stockpiles)Open the finding →Exactly one state has ever walked away.South Africa built six, dismantled six, and left. In eighty years of this ledger, its zero is the only one anyone earned.The Arsenal · the nine, C1published 2026-08-29 · data cutoff 2026 (stockpiles)Open the finding →The fortieth trillion took 154 days.The first took 191 fiscal years. The ladder's rungs have shortened from centuries to decades to seasons — the fortieth crossed on August 18, 2026.The Debt Ledger · the ladder, A1edition 1 · published 2026-08-27 · data cutoff 2026-08-25Open the finding →$90,203 a second, around the clock.The trailing year added $2.84T — arithmetic on two ledger rows a year apart, not a projection.The Debt Ledger · the pace, C1edition 1 · published 2026-08-27 · data cutoff 2026-08-25Open the finding →Doubled, doubled, and doubled again.$5T in 1996 · $10T in 2008 · $20T in 2017 · $40T in 2026 — three doublings in thirty years, each faster in dollars than the one before.The Debt Ledger · the climb, B1edition 1 · published 2026-08-27 · data cutoff 2026-08-25Open the finding →The ledger is two ledgers.$32.3T is owed to the public — markets, funds, foreign holders — and $7.8T to the government's own trust funds. The staircase splits them.The Debt Ledger · the pace, C1edition 1 · published 2026-08-27 · data cutoff 2026-08-25Open the finding →Two-thirds of humanity lives below replacement.67.8% by 2023 population weights — up from under 2% of today's map in 1960. The turn is not coming; on the record, it has happened.The Demographic Turn · the count, B1edition 1 · published 2026-08-27 · data cutoff 2023 (latest World Bank year)Open the finding →The count only climbs.5 countries in 1960 · 42 in 1980 · 80 in 2000 · 119 in 2023. In sixty-three years of records the below-replacement count has never fallen for long.The Demographic Turn · the count, B1edition 1 · published 2026-08-27 · data cutoff 2023 (latest World Bank year)Open the finding →Iran: 7.5 to 1.7 in one lifetime.The record's steepest great fall — with Kuwait, Brunei and Costa Rica on the same slope. The fastest transitions were not in Europe.The Demographic Turn · the fallers, C1edition 1 · published 2026-08-27 · data cutoff 2023 (latest World Bank year)Open the finding →South Korea: 0.75.The lowest national fertility ever recorded in this series — at that rate each generation is about a third the size of the one before it, as arithmetic, not prophecy.The Demographic Turn · the fallers, C1edition 1 · published 2026-08-27 · data cutoff 2023 (latest World Bank year)Open the finding →The books and the graves disagree — by country.Egypt's excess ran 14.51 times its reported toll; the Philippines 4.35; Russia 3.35; the United States 1.13. The undercount is not a property of the pandemic — it is a property of the counting.The Excess · the gap, B1published 2026-08-29Open the finding →Two countries, one toll, two stories.Russia and the United States carry nearly identical excess estimates — about 1.35 million each — with officially reported tolls three times apart. Both facts, one board.The Excess · the gap, B1published 2026-08-29Open the finding →You do not need a model to see it.Set the pandemic months over the registry's own five-year range and the excess is visible to the naked eye — the raw record carries the argument without a single fitted line.The Excess · the raw record, C1published 2026-08-29Open the finding →3.1 times the grain from the same field.A world hectare gave 1.35 tonnes of cereal in 1961 and 4.21 in 2024 — a staircase of six decades whose highest step, 2023's 4.23, stands at the record's far end.The Harvest · the revolution, A1published 2026-08-29Open the finding →Half the land per person.Arable land behind each living person fell from 0.36 to 0.17 hectares while the yield line tripled — two units, two panels, and a counterfactual this page declines to compute.The Harvest · the shrinking field, B1published 2026-08-29Open the finding →The pasture peak.Grazing land — the largest human use of land on Earth — peaked at 3.28 billion hectares in 2001 and stands at 3.20 billion in 2025. The largest land use humanity has is shrinking.The Harvest · the ten thousand years, C2published 2026-08-29Open the finding →Biology beat Moore's law.The genome halved in cost every 1.04 years — a 181,585-fold collapse in 21 years. The fastest sustained price decline in the industrial record is not in silicon.The Learning Curves · the curves, A1published 2026-08-29 · data cutoff 2026-08-29Open the finding →The energy curves are slower — and unstoppable.Solar halves every 6.4 years, batteries every 4.9 — for five decades and three, respectively, through every cycle and shock in between.The Learning Curves · the frontiers, B1published 2026-08-29 · data cutoff 2026-08-29Open the finding →Launch is a scatter, not a line.61 vehicles, three classes, six decades — and the modern lower edge sits orders of magnitude below the frontier of the 1960s. The record refuses a single curve, so the report does too.The Learning Curves · the launch frontier, C1published 2026-08-29 · data cutoff 2026-08-29Open the finding →The gate does not bend.22 to 59 novel drugs a year, a decade running, while sequencing collapsed six orders of magnitude behind it. Learning curves bend prices — not institutions.The Learning Curves · the gate, D1published 2026-08-29 · data cutoff 2026-08-29Open the finding →13,584 storms, every one with a path.The ledger of the sky goes back before the telegraph — and the atlas plays all of it, from unnamed sail-era terrors to this season's lettered list.The Names of the Storms · the atlas, A1edition 1 · published 2026-08-29 · data cutoff 2026 season in progressOpen the finding →The climb is the watchers.Season counts triple across the archive — with the jumps landing exactly at aircraft reconnaissance and satellite coverage. The record grew eyes, and the exhibit says so.The Names of the Storms · the ledger, B1edition 1 · published 2026-08-29 · data cutoff 2026 season in progressOpen the finding →The coasts always kept better books.Landfall counts hold steadier than sea counts across every era — where storms meet people, the record was always surest.The Names of the Storms · the ledger, B1edition 1 · published 2026-08-29 · data cutoff 2026 season in progressOpen the finding →Japan was younger than the world is now.Japan's 1950 median was 21.3 — below the world's 2023 figure of 30.4 — and stands at 49.0 today. The world as a whole is now older than the future's oldest country was at the record's start.The Old World · the divergence, B1published 2026-08-29Open the finding →One country got younger.Nigeria's median fell from 18.1 to 17.8 across the whole record — while South Korea's rose 26.8 years and China passed the United States in 2019. The world line hides all three.The Old World · the divergence, B1published 2026-08-29Open the finding →A 45-year gap between countries.Central African Republic's median is 14.3; Vatican's is 59.6. The same column, the same year — and the widest human age gap the record holds.The Old World · the two ends, C1published 2026-08-29Open the finding →Four markets are one country.Gallium 98.7%, tungsten 82.7%, graphite 79.4% — one flag; cobalt 75.9% — another. The transition's shopping list runs through two capitals.Who Holds the Periodic Table · the ladder, A1published 2026-08-29Open the finding →The diggers and the holders disagree.Australia mines the most lithium; Chile holds the most. Zimbabwe sits on the chromium. Where the names split, the next decade's map is already drawn.Who Holds the Periodic Table · the ground, C1published 2026-08-29Open the finding →Copper is what healthy looks like — and it's 23%.The most diversified market on the list still gives its top producer nearly a quarter. Concentration is not the exception in minerals; it is the norm.Who Holds the Periodic Table · the producers, B1published 2026-08-29Open the finding →Coal is still a third of everything.33% of world generation in 2025 — against 38% in 1985. Forty years of energy transition have so far changed coal's share by five points.The Power Mix · the mix, A1edition 1 · published 2026-08-27 · data cutoff 2025 (latest full year in the record)Open the finding →Solar caught nuclear in 2025.From 32 TWh in 2010 to 2,779 TWh — an 86-fold climb in fifteen years, to within a rounding error of the technology that had a fifty-year head start.The Power Mix · the machines, B1edition 1 · published 2026-08-27 · data cutoff 2025 (latest full year in the record)Open the finding →The mix writes the carbon number.41 gCO₂/kWh in France (69% nuclear) · 525 in China · 1,000 in Uzbekistan — a 24-fold spread that maps almost perfectly onto the low-carbon share.The Power Mix · the consequence, C1edition 1 · published 2026-08-27 · data cutoff 2025 (latest full year in the record)Open the finding →The 163-fold divide.Norway draws 28,598 kWh per person per year; Nigeria 175. Half the story of world power is who has it.The Power Mix · the divide, D1edition 1 · published 2026-08-27 · data cutoff 2025 (latest full year in the record)Open the finding →The money is filed; the deals are not.Capital spending grew 65% year on year in the filings themselves — while zero of the twenty-one publicly claimed mega-deals traces to a filing. Both true, on one board.The Pressure Board · the collision, B1published 2026-08-29Open the finding →The wedge meets a machine at full stretch.Data centers may need 17–46 GW of new around-the-clock power by 2028; the best build year in the modern record delivered 57 — once, for everything at once.The Pressure Board · the collision, B1published 2026-08-29Open the finding →The line grows ten times faster than it clears.890 GW entered the interconnection queues in one year. History builds 14.8% of what enters. Neither number bends the other.The Pressure Board · the collision, B1published 2026-08-29Open the finding →The queue is 1.7× the entire fleet.2,363 GW are waiting for a grid connection — against 1,405 GW operating. America's power problem is not ambition; it is the line at the door.The Queue · the queue, B1published 2026-08-28 · data cutoff 2026-08-28Open the finding →Fifteen cents on the dollar.Of the 2,613 GW that entered the queue 2000–2018, 14.8% reached operation and 76.9% withdrew — after a median 3.1 years in line. The queue is where capacity waits, and mostly where it dies.The Queue · the queue, B1published 2026-08-28 · data cutoff 2026-08-28Open the finding →2025 set the record the decade must repeat.57 GW entered service — the biggest year since the 2002 gas boom's 70. The planned list promises 286 GW more; history says treat every date on it as an opening bid.The Queue · the build rate, C1published 2026-08-28 · data cutoff 2026-08-28Open the finding →The floor clears; the ceiling doesn't.At LBNL's low case the wedge is absorbed with room to spare. At its high case the planned list falls short under every slippage scenario — and the shortfall lands hardest where the queue is thickest.The Queue · the verdict, D1published 2026-08-28 · data cutoff 2026-08-28Open the finding →One company is two-thirds of the sky.11,042 of 16,472 active satellites are Starlink — 67%, launched almost entirely since 2019. The space age's population chart is now a corporate chart.The Signal Grid · the swarm, B1published 2026-08-28 · data cutoff 2026-08-28Open the finding →The ring stands still — so we pinned it.585 geostationary satellites mapped at their true longitudes, computed from the orbital record itself. The crowded arcs sit over the meridians the traffic pays for.The Signal Grid · the strata, A1published 2026-08-28 · data cutoff 2026-08-28Open the finding →A few thousand drive; twelve thousand drink.2,655 content networks against 12,384 eyeball networks — the registry's own census of upstream and downstream — meeting in 1,320 exchanges, São Paulo's the largest on Earth.The Signal Grid · the flow, C1published 2026-08-28 · data cutoff 2026-08-28Open the finding →The catalogs admit 24.The public military group holds 24 active satellites — and 3,992 more carry no public purpose at all. What the record cannot classify, this page counts rather than invents.The Signal Grid · the listening layer, D1published 2026-08-28 · data cutoff 2026-08-28Open the finding →One person in 379.In 1945, one person in 31 alive was under arms. In 2016, one in 379. The armed share of humanity fell by a factor of twelve from its summit — the lowest armed share the two-century record holds.The Standing Army · the long line, A1published 2026-08-29Open the finding →Fewer soldiers, dearer each.From 1988 to 2016 the armed share fell from 5.64 to 2.64 per 1,000 while spending per soldier rose from $61,292 to $99,581 — the same years, opposite directions, two units this page declines to merge.The Standing Army · the divergence, B1published 2026-08-29Open the finding →Every giant is a former giant.All eight majors' largest armies are decades past — 5 peaked in 1945 alone. The biggest force standing in the file's last year, China's 2,333 thousand, is less than a fifth of the column's all-time high.The Standing Army · the majors, C1published 2026-08-29Open the finding →The long peace is measured, not imagined.The death rate of the last eighty years sits — below the six-century median — and the line, not this sentence, carries the claim.The War Record · the long line, A2edition 1 · published 2026-08-28 · data cutoff 2024 (latest UCDP year)Open the finding →War changed species.Interstate war is 12.1% of recorded conflict deaths since 1989 — the modern record is civil war and violence against civilians. 2022 broke the pattern.The War Record · the shape, B1edition 1 · published 2026-08-28 · data cutoff 2024 (latest UCDP year)Open the finding →Two wars dwarf two centuries.The World Wars carry 79% of all battle deaths on the mapped record since 1816 — the house's concentration pattern, at its darkest.The War Record · the atlas, A1edition 1 · published 2026-08-28 · data cutoff 2024 (latest UCDP year)Open the finding →Every oil shock has a war at its door.1973 · 1979 · 1990 · 2022 — the flags sit on the price line itself. The direction of cause runs price←war, and the page says so.The War Record · the correlates, C1edition 1 · published 2026-08-28 · data cutoff 2024 (latest UCDP year)Open the finding →1976 was the last year below the baseline.49 consecutive years have now come in above the 1951–1980 mean — a streak longer than most working lifetimes.The Warming Record · the stripes, A1edition 1 · published 2026-08-27 · data cutoff 2026-07 (latest complete month)Open the finding →The three hottest years are the last three.2024 (+1.28°C), then 2025 and 2023 — the record's entire podium sits inside the most recent three years of a 146-year series.The Warming Record · the staircase, B1edition 1 · published 2026-08-27 · data cutoff 2026-07 (latest complete month)Open the finding →Seven steps up, none down.Every completed decade since the 1950s has been warmer than the decade before it — the staircase is monotonic for seventy years.The Warming Record · the staircase, B1edition 1 · published 2026-08-27 · data cutoff 2026-07 (latest complete month)Open the finding →September 2023: +1.48°C, the field's deepest cell.The hottest single month against its baseline in 1,759 measured months — inside the 2023–2025 column that darkens the whole field's edge.The Warming Record · the months, C1edition 1 · published 2026-08-27 · data cutoff 2026-07 (latest complete month)Open the finding →One event owns the month.The M7.7 near Ende, Indonesia released 64% of the entire window's seismic energy by itself — hundreds of smaller shocks barely register beside it. Magnitude is a log scale, and the energy budget exhibit makes that violence visible.Thirty Days of Earth · the energy budget, B2published 2026-08-27 · data cutoff 2026-08-27Open the finding →What the famous arcs actually carried.Japan, the Kamchatka–Kuril arc, and the Alaska–Aleutians carried 11% of the month's M4.5+ events yet only 1% of its energy — because this window's giant struck the Flores arc instead. Busy is not violent, and the hotspot compare draws exactly that disagreement.Thirty Days of Earth · hotspots, C4published 2026-08-27 · data cutoff 2026-08-27Open the finding →Depth is structure, not noise.26 shocks struck deeper than 300 km, and they are not scattered — they stack into the Tonga–Fiji column where the Pacific floor dives into the mantle. A month of records is enough to see the planet's plumbing.Thirty Days of Earth · the section, B3published 2026-08-27 · data cutoff 2026-08-27Open the finding →The tsunami layer's finding is a zero, and it says so.0 of 637 quakes this window carry the USGS tsunami flag — the 7.7 included. The layer stays on the map reporting its zero, because absence stated is data and absence hidden is a lie of omission.Thirty Days of Earth · the map, A1published 2026-08-27 · data cutoff 2026-08-27Open the finding →What NASA watches most is fire.1,299 of 1,374 tracked natural events are wildfires — a count of tracked incidents, not burned area, and the method says so — with floods riding the monsoon belt a distant second.Thirty Days of Earth · the map layers, A1published 2026-08-27 · data cutoff 2026-08-27Open the finding →